Two classes take the same test. In the smaller class, 95% pass. In the larger class, 45% pass. What percentage of all the students pass?
The tempting answer is 70%: add the percentages and divide by two. But if the classes have different numbers of students, that calculation answers a different question.
To combine percentages, count what each percentage is a percentage of. The denominators tell you how much weight each group should receive.
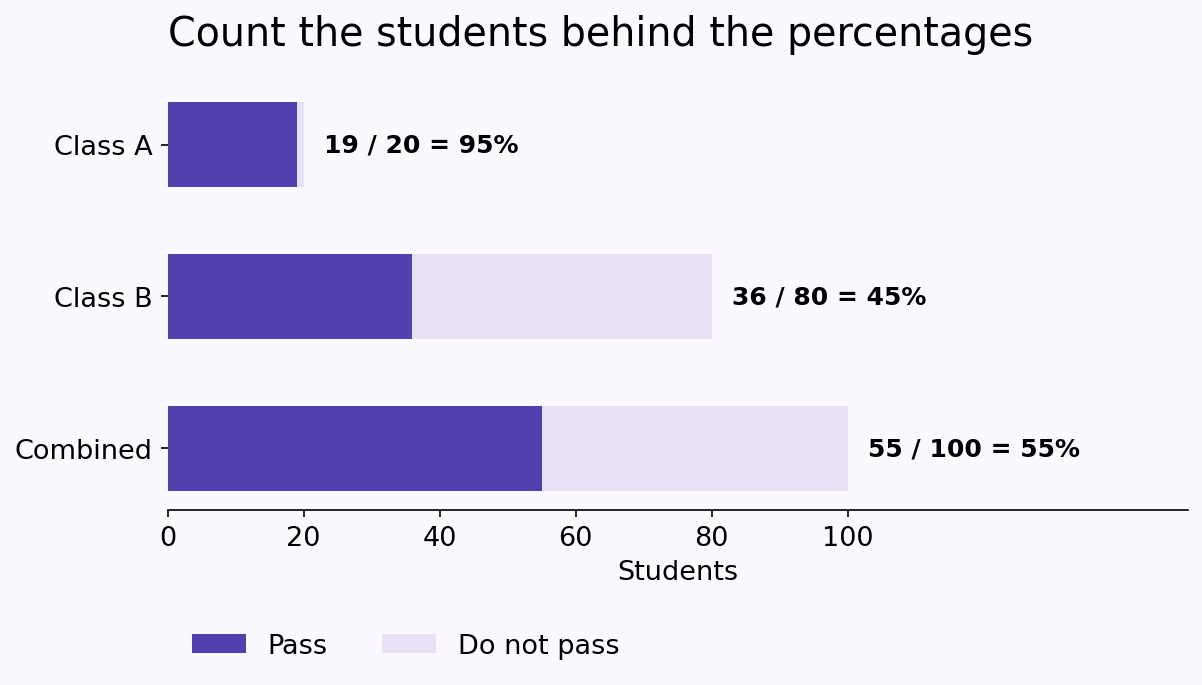
Count the students first
Suppose the first class contains 20 students and the second contains 80. These are hypothetical figures:
- Class A: 19 of 20 students pass, giving 95%.
- Class B: 36 of 80 students pass, giving 45%.
Across the two classes, 55 of 100 students pass. The combined pass rate is therefore
\[\frac{19+36}{20+80}\times100\%=55\%.\]
The unweighted average, \((95\%+45\%)/2=70\%\), treats the two classes as equally important units. It is the average of their class-level rates. The 55% figure instead gives every student equal weight.
Neither operation is mysterious. The mistake is using one answer while describing the other question.
Why the larger group pulls the result toward its rate
Four fifths of the students belong to Class B. It should therefore contribute four fifths of the combined student-level rate:
\[0.20(95\%)+0.80(45\%)=19\%+36\%=55\%.\]
This is a weighted average. Written using the group sizes directly, it is
\[\frac{20(95)+80(45)}{20+80}=55,\]
where the rates are entered as percentage numbers. A percentage is still a fraction; weighting reconstructs the underlying counts.
The general rule
If group i has \(s_i\) successes among \(n_i\) observations, the overall success rate is
\[p=\frac{\sum_i s_i}{\sum_i n_i}.\]
If you know the group proportions \(p_i=s_i/n_i\) and their sizes, the same calculation becomes
\[p=\frac{\sum_i n_i p_i}{\sum_i n_i}.\]
This assumes the groups can legitimately be combined: observations should not be counted twice, and “success” should mean the same thing in every group. Combining percentages from incompatible definitions will not become meaningful just because the arithmetic is correct.
When a simple average does work
If every group has the same size, averaging their percentages gives the same result as pooling the counts. For example, 12 of 20 and 18 of 20 give rates of 60% and 90%. Their average is 75%, and the combined count is 30 of 40, also 75%.
An unweighted average may also be the intended summary when the units of interest are the groups themselves. A researcher might explicitly want the average school-level rate, giving each school equal weight. That is a different target from the rate among all students.
State which population your average describes. “Average across schools” and “percentage of students” should not be used as interchangeable labels.
Rounded percentages can hide the counts
A reported rate of 67% might come from 2 of 3 observations, rounded from \(66.666\ldots\%\). Treating 67% as exact and combining it with other rounded percentages can introduce additional error.
Whenever possible, use the original numerators and denominators. Round the final result for display. If only rounded percentages are available, describe the combined answer as an approximation.
Different rates need different weights
The relevant denominator is not always a count of people. It might be the number of attempts, a distance traveled, or the time spent observing something. An average speed, for instance, comes from total distance divided by total time. Equal distances do not generally justify taking the simple average of two speeds.
Before averaging any rate, write it as “quantity divided by quantity.” That usually reveals which totals belong in the calculation.
A quick check before you average
- Identify the question: a rate for all observations, or an average of group-level rates?
- Find the denominator behind each percentage.
- Check that the groups and definitions are compatible.
- Pool the original counts, or use the appropriate weights.
- Round once, at the end.
Averages are useful summaries, but the word “average” does not choose the right weights for us. That choice comes from the question we are trying to answer.