A confidence interval is a range of values that is likely to contain a population parameter with a specified level of confidence. Confidence intervals (CI) estimate the reliability of an estimate and are important because they provide a range within which we expect the true value to lie. They are more informative than single point estimates because they provide a measure of precision and reliability.
Statisticians and analysts employ confidence intervals to assess the statistical significance of their estimates, inferences, or predictions. If a confidence interval includes the value of zero (or the value specified by the null hypothesis), it implies that the observed effect could be due to chance, and thus, there isn’t sufficient evidence to assert that the result is caused by a specific factor rather than randomness.
For a more practical understanding, we’ll use the 95% confidence interval which means that if we were to repeat our sampling process 100 times, approximately 95 of those confidence intervals would be expected to contain the true population parameter. This level of confidence is chosen by the researcher and impacts the width of the confidence interval: higher confidence levels lead to wider intervals.
Components of Confidence Intervals
In constructing confidence intervals, several statistical components are involved:
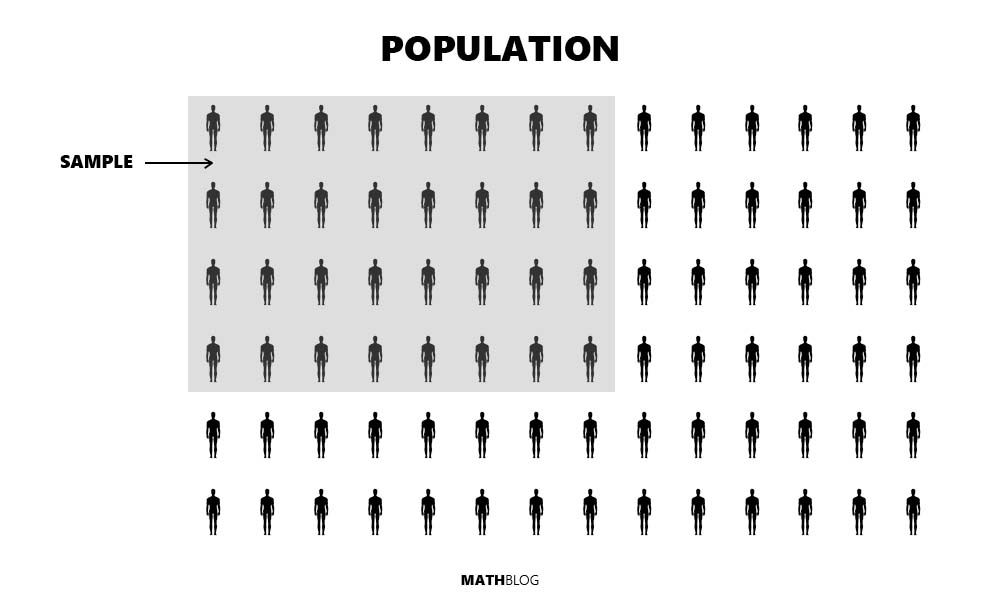
- Sample Mean (X̄): The average value of the sampled data.
- Margin of Error: The range above and below the sample mean which captures the true population mean with a certain level of confidence.
- Standard Deviation (σ) and Standard Error (σ/√n): Standard deviation measures the dispersion of data points. Standard error adjusts this for the size of the sample, providing a measure of the accuracy of the sample mean.
How to Calculate a Confidence Interval
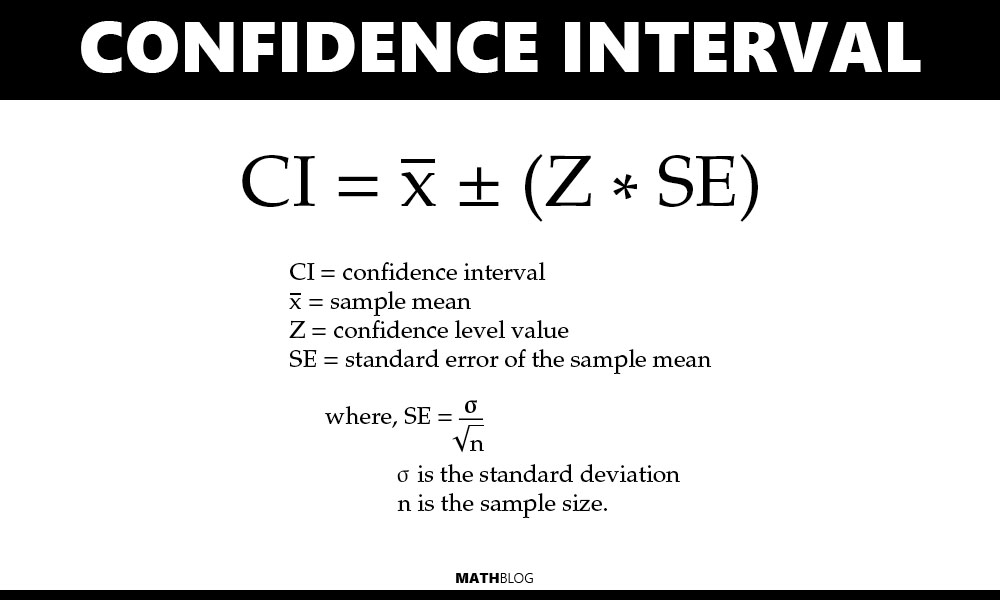
To calculate confidence intervals, the formula incorporates the sample mean, the critical value from the z-distribution or t-distribution, and the standard error of the mean. The formula for constructing a confidence interval is:
Where:
- CI is the confidence interval
\( \bar{X} \) is the sample mean- Z is the z-score or t-score that corresponds to the desired confidence level
- SE is the standard error of the sample mean, and it’s calculated as
\( SE = \frac{\sigma}{\sqrt{n}}\) where:- σ is the standard deviation
- n is the sample size.
The z-value required for your calculations varies based on the selected confidence level. Below is a table that outlines the z-values corresponding to commonly used confidence levels:
| Confidence Level | z-value |
|---|---|
| 90% | 1.645 |
| 95% | 1.96 |
| 99% | 2.58 |
Confidence Interval Calculation Example
Example 1
Here’s a simple example. Suppose we have a sample of 50 students’ test scores with a mean score of 78 and a standard deviation of 12. To calculate a 95% confidence interval (e.g., Z = 1.96 for a 95% confidence interval using the z-distribution):
- Standard Error: \( SE = \frac{12}{\sqrt{50}} \approx 1.70 \)
- Confidence Interval: \( CI = 78 \pm (1.96 \times 1.70) = 78 \pm 3.33 \)
- Therefore, the confidence interval is 74.67 to 81.33.
This means we are 95% confident that the average test score of all students lies between 74.67 and 81.33.
Example 2
A more thorough example on how to calculate the confidence interval is to use a complete data sample.
Assume a dataset that includes the heights of 40 adult males measured in centimeters. The dataset represents a sample from a larger population and is given as follows:
178, 172, 181, 169, 180, 174, 177, 185, 176, 180,
175, 173, 174, 178, 182, 175, 177, 186, 173, 172,
180, 170, 174, 169, 178, 176, 180, 175, 179, 177,
171, 174, 180, 173, 172, 177, 176, 180, 179, 173.
Calculate the 95% confidence interval for the average height of adult males in this population.
SOLUTION
- First we need to calculate the sample mean.
- Formula:
\( \bar{X} = \frac{\text{Sum of all heights}}{n} \) - Sum of all heights = 178 + 172 + … + 179 + 173 = 7,050
- The sample mean
\( \bar{X} = 7,050 / 40 = 176.25 \)
- Then we’ll calculate the Standard Deviation (σ). We need to subtract the mean from each data point, squaring the result, summing all these squares, and then taking the square root of the sum divided by n−1.
- Formula:
\( \sigma = \sqrt{\frac{\sum (X_i – \bar{X})^2}{n-1}} \) \( \sigma = \sqrt{\frac{(178 – 176.25)^2 + (172 – 176.25)^2 + … + (179 – 176.25)^2) + (173 – 176.25)^2} {39}} \) - σ = 4.02.
- Using the standard deviation calculated above and the sample size of 40, we’ll calculate the Standard Error (SE).
- Formula: \( SE = \frac{\sigma}{\sqrt{n}}\)
\( SE = \frac{4.02}{\sqrt{40}} = 0.6356 \)
- We’ll now apply the 95% confidence level to determine the interval around the sample mean that is expected to contain the true population mean. The Z-score corresponding to a 95% confidence level is 1.96.
- \( CI = 176.25 \pm (1.96 \times
0.6356 ) = 176.25 \pm 1.24 \)
RESULT:
The 95% confidence interval for the average height of the dataset is approximately 175cm to 177.5cm. This means we can be 95% confident that the true average height of the adult male population lies within this range.
NOTE: If you’d like to simplify everything, use our confidence interval calculator tool.
Types of Confidence Intervals
Confidence Interval for a Mean
A confidence interval for a mean is a statistical tool used to estimate the range within which the true average of a population is likely to be found, based on sample data. This type of interval is crucial for understanding where the population mean might actually lie, considering the natural variations in any sample.
Formula:
\( \bar{x} \) : Sample mean- \( z \): Z-value for the chosen confidence level
- \( s \): Sample standard deviation
- \( n \): Sample size
Purpose: Estimates the range likely to contain the population mean.
Confidence Interval for the Difference Between Means
A confidence interval for the difference between means is designed to estimate the range within which the difference between the means of two populations is likely to fall. This is particularly useful in comparative studies, such as clinical trials or business A/B testing, where the impact of different conditions on a mean is analyzed.
Formula:
\( \bar{x}_1, \bar{x}_2 \) : Means of sample 1 and sample 2, respectively- \( t \): T-critical value for the confidence level and n1+n2−2 degrees of freedom
- \( s_p^2 \): Pooled variance
- \( n_1, n_2 \): Sizes of sample 1 and sample 2
Purpose: Estimates the range likely to contain the true difference between two population means.
Confidence Interval for a Proportion
A confidence interval for a proportion provides an estimated range of values within which the true proportion of a population characteristic is expected to lie. This type of interval is valuable for surveys and polls, where a proportion, such as the percentage of voters favoring a particular candidate, needs to be estimated from sample data.
Formula: \( CI = p \pm z \times \sqrt{\frac{p(1-p)}{n}} \)
- \( p \): Sample proportion
- \( z \): Z-value for the chosen confidence level
- \( n \): Sample size
Purpose: Estimates the range likely to contain a population proportion.
Confidence Interval for the Difference in Proportions
A confidence interval for the difference in proportions is used to estimate the range within which the difference between two population proportions is expected to be found. This method is essential in fields like epidemiology and market research, where understanding the difference in proportions between two groups can guide significant decisions.
Formula: \( CI = (p_1 – p_2) \pm z \times \sqrt{\frac{p_1(1-p_1)}{n_1} + \frac{p_2(1-p2)}{n_2}} \)
- \( p1, p2 \): Proportions of sample 1 and sample 2, respectively
- \( z \): Z-value for the chosen confidence level
- \( n1, n2 \): Sizes of sample 1 and sample 2
Purpose: Estimates the range likely to contain the true difference between two population proportions.