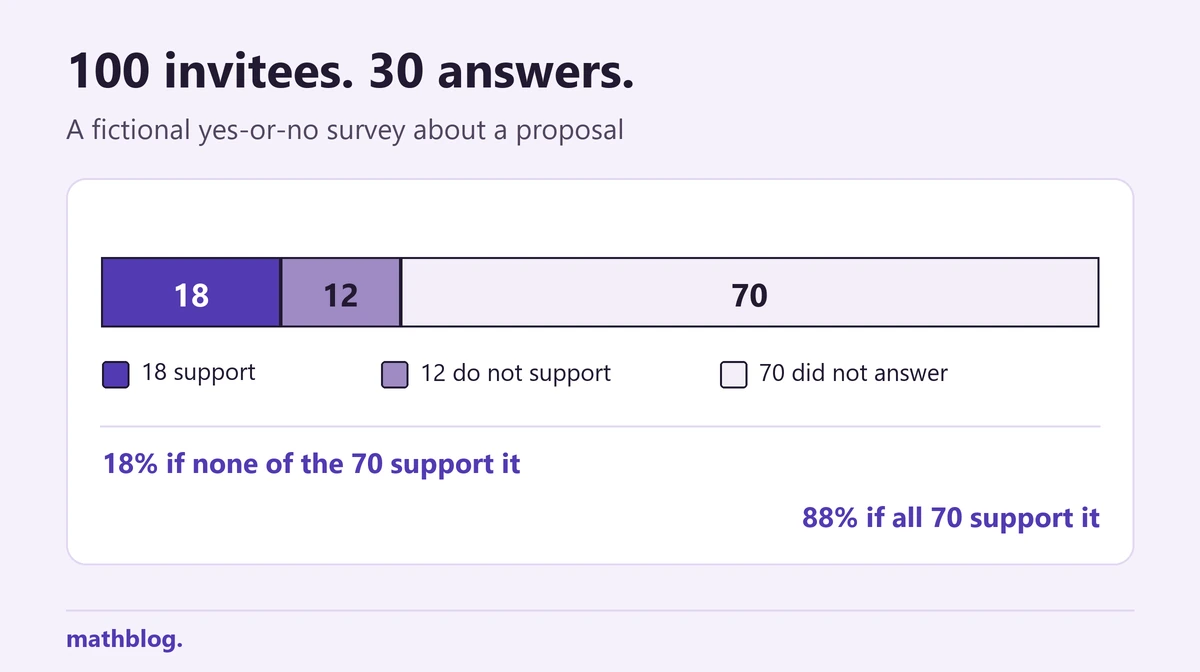
Imagine sending a yes-or-no survey about a proposal to 100 people. Thirty answer. Eighteen say yes and 12 say no, so 60% of the people who answered support the proposal.
Among all 100 invitees, support could be as low as 18% or as high as 88%. The answers from those 30 people leave 70 opinions unknown.
Keep track of who is in the denominator
Divide the 18 yes answers by the 30 people who responded to get the support rate among respondents. Divide those 30 respondents by the 100 invitees to get the response rate.
\[\frac{18}{30}=60\%,\qquad \frac{30}{100}=30\%\]
These percentages answer different questions. If you quote the 60%, include “of the 30 respondents” so readers know whose answers it represents. The same issue comes up when comparing percentages from groups of different sizes.
Find the lowest and highest possible support
If none of the 70 people who did not answer support the proposal, there are 18 supporters among the 100 invitees. If all 70 support it, there are 88 supporters. The 12 people who answered no cap the total at 88.
\[\frac{18+0}{100}=18\%,\qquad \frac{18+70}{100}=88\%\]
Every whole percentage from 18% through 88% is possible given the answers. For example, the proposal would have exactly 50% support among invitees if 32 of the 70 people who did not answer supported it. The counts alone leave the chance of any particular total unknown.
Report the result and the missing responses
A report could say, “Thirty of 100 invitees answered. Eighteen of the 30 support the proposal.” If you need to know how the full group feels, follow up with people who haven’t responded. If they’re less likely to support the proposal than the people who replied, the 60% figure will overstate support among invitees. If they’re more likely to support it, the figure will understate it.