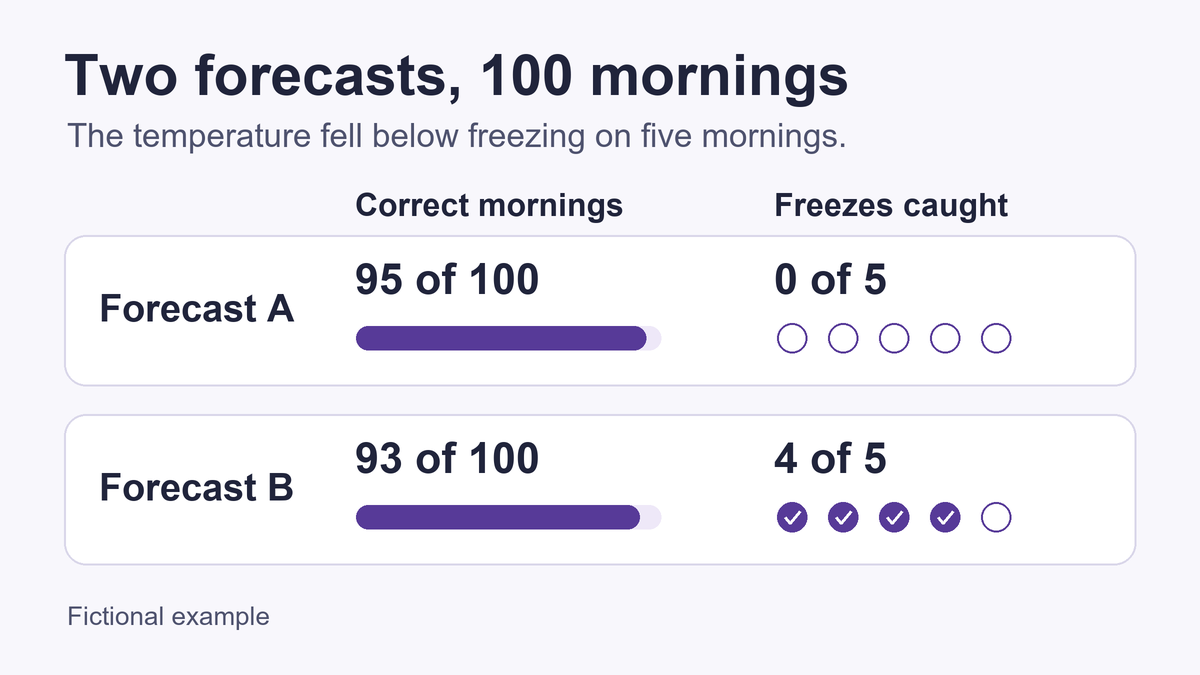
In a fictional example, the temperature at one location drops below 32°F on five of 100 mornings. A forecast that says “no freeze” every day gets 95 mornings right and misses all five freezes.
On the same mornings, a second forecast catches four freezes and calls for a freeze six times when none occurs. It gets 93 mornings right. Both percentages are correct. The difference is in what each forecast gets wrong.
Count the four ways a forecast can turn out
Compare each morning’s forecast with what actually happened at the same location. A hit means a freeze was forecast and occurred. A miss means a freeze occurred without being forecast. A false alarm means a freeze was forecast but did not occur. The fourth outcome is a correct no-freeze forecast.
| Outcome | Forecast A | Forecast B |
|---|---|---|
| Hits | 0 | 4 |
| Misses | 5 | 1 |
| False alarms | 0 | 6 |
| Correct no-freeze forecasts | 95 | 89 |
| Total mornings | 100 | 100 |
To check the table, add the hits and misses in each column. Both sums are five because the forecasts are judged on the same five freezes. For forecast B, six of the 95 mornings without a freeze produced false alarms, leaving 89 correct no-freeze forecasts.
Overall accuracy counts every morning
Count both kinds of correct forecast and divide by the number of mornings. Forecast A gets \(0+95=95\) right, or 95%. Forecast B gets \(4+89=93\) right, or 93%. Accuracy gives each morning the same weight. In this set, 95 of those mornings had no freeze.
The hit rate counts only mornings that froze
To find the fraction of freezes each forecast caught, divide its hits by the five mornings that actually froze. This is the hit rate, also called the probability of detection. Forecast A caught \(0/5=0\%\). Forecast B caught \(4/5=80\%\).
A different question starts with the ten mornings when forecast B called for a freeze. Six of those calls were false alarms, so its false alarm ratio is \(6/10=60\%\). Forecast A never called for a freeze. Its false alarm ratio is undefined because the denominator is zero.
Forecast B’s 80% and 60% come from different groups of mornings. One starts with the freezes that happened. The other starts with the freezes the model predicted. As with percentages calculated for different groups, the denominator tells you what each percentage describes.
What matters if you are covering plants?
If you cover your plants whenever a forecast calls for a freeze, following forecast A means leaving them uncovered on all five freezing mornings. Following forecast B means covering them on four of those mornings and putting the covers on six times when they turn out to be unnecessary.
How you weigh the missed freezes against the extra work depends on the plants and how much time it takes to cover them. With only five freezes in the example, catching one more would move the hit rate by 20 percentage points.
Further reading
- NOAA · National Severe Storms LaboratoryHow a contingency table scores weather warningsSee how forecasters count hits, misses, and false alarms and use them to calculate detection and false alarm measures.
- MathBlog · ArithmeticHow to calculate percentagesPractice identifying the whole and expressing a part of it as a percentage.