Imagine a bus that comes at minute 0, then at minute 5, then at minute 20. The gaps keep alternating between five and 15 minutes, so the average gap is 10 minutes. If you arrive at a random time, your average wait is 6.25 minutes.
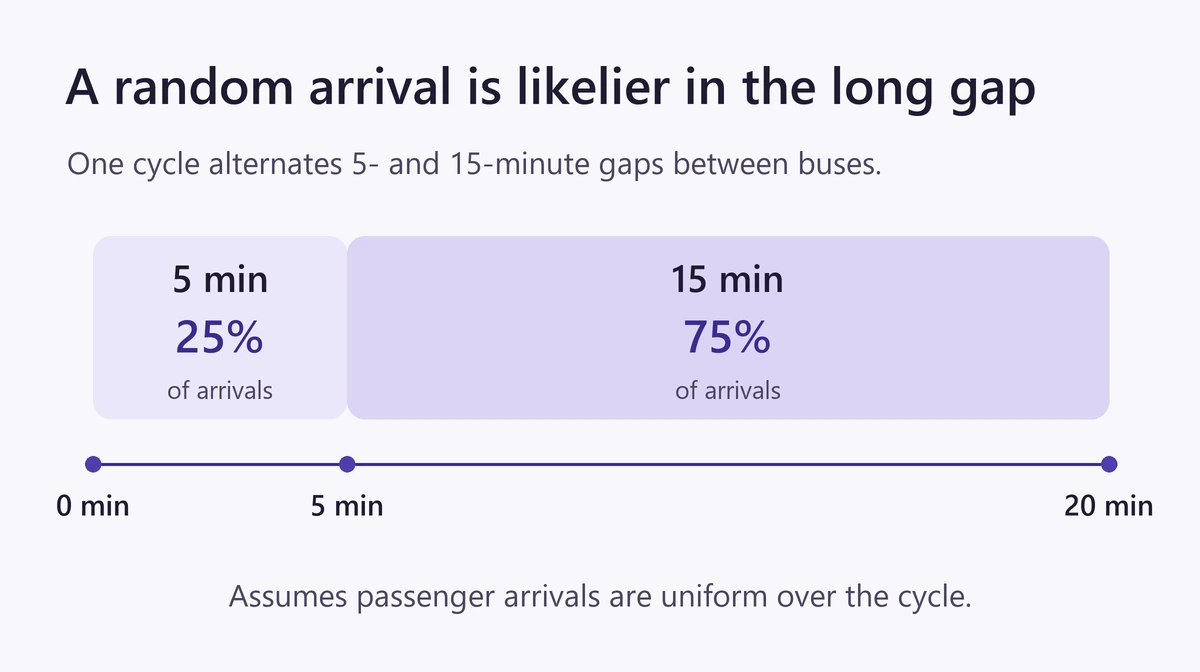
The 15-minute gap takes up three quarters of each cycle. A random arrival is three times as likely to fall in that gap as in the shorter one.
Count the minutes where you could arrive
Take one 20-minute cycle of this fictional timetable. Assume any interval of the same length within that cycle is equally likely to contain your arrival. The first five minutes lie in the short gap. The next 15 lie in the long gap. So the chances of arriving in the two gaps are \(\frac{5}{20}=\frac14\) and \(\frac{15}{20}=\frac34\).
Average the wait inside each gap
In the five-minute gap, the wait ranges from almost five minutes just after the bus leaves to almost zero just before the next one. Since you can arrive uniformly anywhere in the gap, the average wait is 2.5 minutes. The average within the 15-minute gap is 7.5 minutes.
Weight those averages by the chances of arriving in each gap.
\[\frac14\times2.5+\frac34\times7.5=6.25\text{ minutes}\]
What changes if the buses come evenly?
If both gaps are 10 minutes, the average wait drops to five minutes. In the uneven schedule, arriving just after minute 5 and before minute 10 leaves more than 10 minutes until the bus at minute 20. That stretch takes up a quarter of the cycle.
These waits come from the repeating timetable and the random-arrival assumption. If you time your walk to catch a particular departure, your arrival times will cluster near that bus. For another example where the time spent in each part changes an average, see average speed over equal distances.