Standard deviation measures how spread out values are around their mean. It is the square root of a variance, so it is expressed in the same units as the original observations.
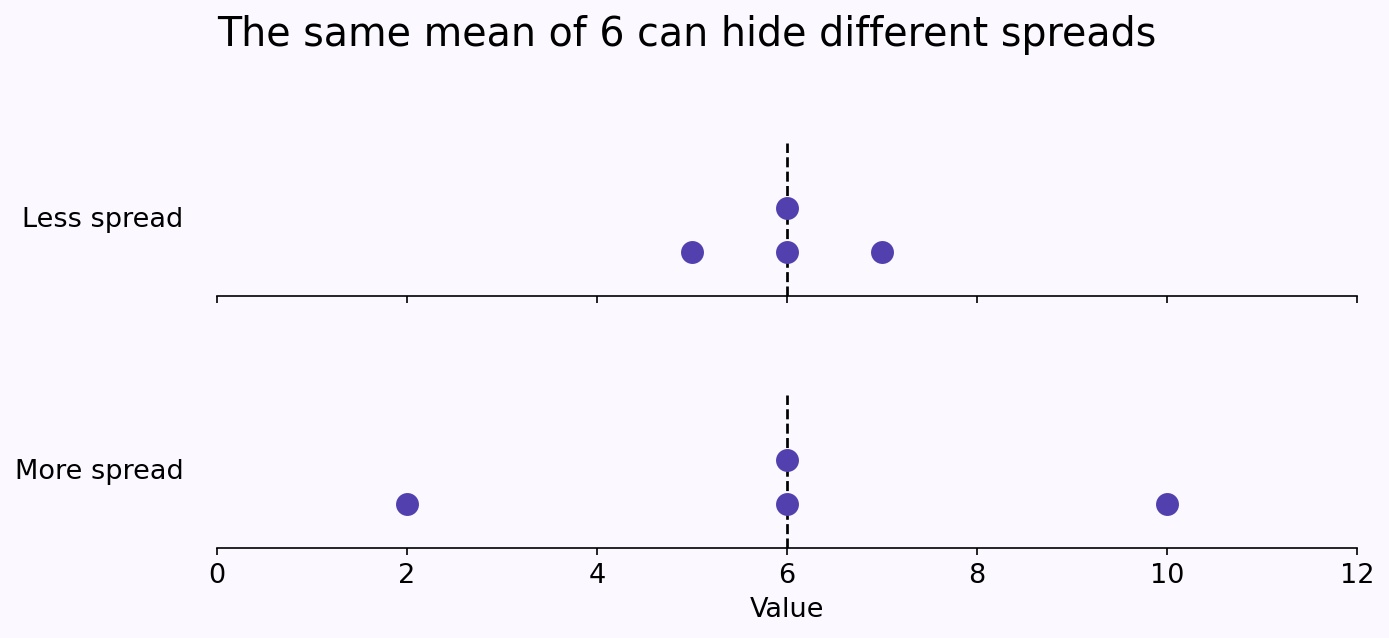
Two datasets can have the same mean but very different spreads. The values 5, 6, 6, 7 and the values 2, 6, 6, 10 both average 6. The second set extends much farther from that center.
Population and sample formulas
If the values are the entire population you want to describe, the population standard deviation is
\[\sigma=\sqrt{\frac{\sum_{i=1}^{N}(x_i-\mu)^2}{N}},\]
where \(\mu\) is the population mean and N is the number of population values.
If the values are a sample used to estimate variability in a larger population, the usual sample standard deviation is
\[s=\sqrt{\frac{\sum_{i=1}^{n}(x_i-\bar{x})^2}{n-1}}.\]
Here, \(\bar{x}\) is the sample mean, and the formula requires at least two observations. The choice between these formulas comes from the purpose of the data, not from whether the list is short or long.
A complete worked example
Consider four hypothetical task completion times: 4, 6, 6, and 8 minutes. We will calculate both versions so the difference is visible.
1. Find the mean
\[\bar{x}=\frac{4+6+6+8}{4}=6\text{ minutes}.\]
For a refresher, see how to find the mean.
2. Subtract the mean and square each difference
| Value | Deviation | Squared deviation |
|---|---|---|
| 4 | −2 | 4 |
| 6 | 0 | 0 |
| 6 | 0 | 0 |
| 8 | 2 | 4 |
The squared deviations add to 8. Squaring prevents positive and negative deviations from canceling. In this example, the unsquared deviations sum to \(-2+0+0+2=0\), which does not mean there is no variation.
3. Divide using the appropriate denominator
If these four times are the complete population of interest, the population variance is
\[\sigma^2=\frac84=2\text{ minutes}^2.\]
If they are a sample used to estimate a wider population’s variance,
\[s^2=\frac8{4-1}=\frac83\approx2.6667\text{ minutes}^2.\]
4. Take the square root
The population standard deviation is
\[\sigma=\sqrt2\approx1.4142\text{ minutes}.\]
The sample standard deviation is
\[s=\sqrt{8/3}\approx1.6330\text{ minutes}.\]
The different answers reflect different denominators and different statistical purposes. They are not competing calculations of one unspecified quantity.
Why does the sample formula use n − 1?
The sample mean is estimated from the same observations. Once the mean and all but one of the deviations are known, the last deviation is determined because the deviations sum to zero.
For independent observations from a common population with finite variance, dividing the sum of squared deviations by \(n-1\) gives an unbiased estimator of the population variance. Taking its square root does not make the resulting standard deviation an exactly unbiased estimator of population standard deviation. These two claims should be kept separate.
What the result tells you
A standard deviation of zero means all values in the list are equal. Larger values indicate more spread, but “large” depends on the units and the context. Comparing 2 centimeters with 2 meters without converting units would be meaningless.
Standard deviation gives extra weight to observations far from the mean because deviations are squared. An extreme observation can increase it substantially. For skewed data, a median and interquartile range may provide a useful complementary summary.
The familiar statement that about 68% of values lie within one standard deviation of the mean applies approximately to normal distributions. It is not a universal rule for every dataset.
Standard deviation is not standard error
Standard deviation describes variation among observations. The standard error of a sample mean describes its sampling variability. Under an independent, identically distributed sampling model, it is commonly estimated by \(s/\sqrt{n}\).
A larger sample can make the mean more precise without making the observations themselves less variable. This distinction matters when interpreting a confidence interval.
Before reporting an answer
- State whether you used the population or sample formula.
- Include the units and number of observations.
- Keep unrounded values during the calculation.
- Check for data-entry mistakes and investigate unusual observations.
When the formula, denominator, and units are explicit, another reader can reproduce the answer rather than having to guess what “standard deviation” means in the report.