Variance measures how spread out a set of values is by using their squared distances from the mean. The population formula averages those squared distances. The usual sample formula divides their total by one less than the sample size.
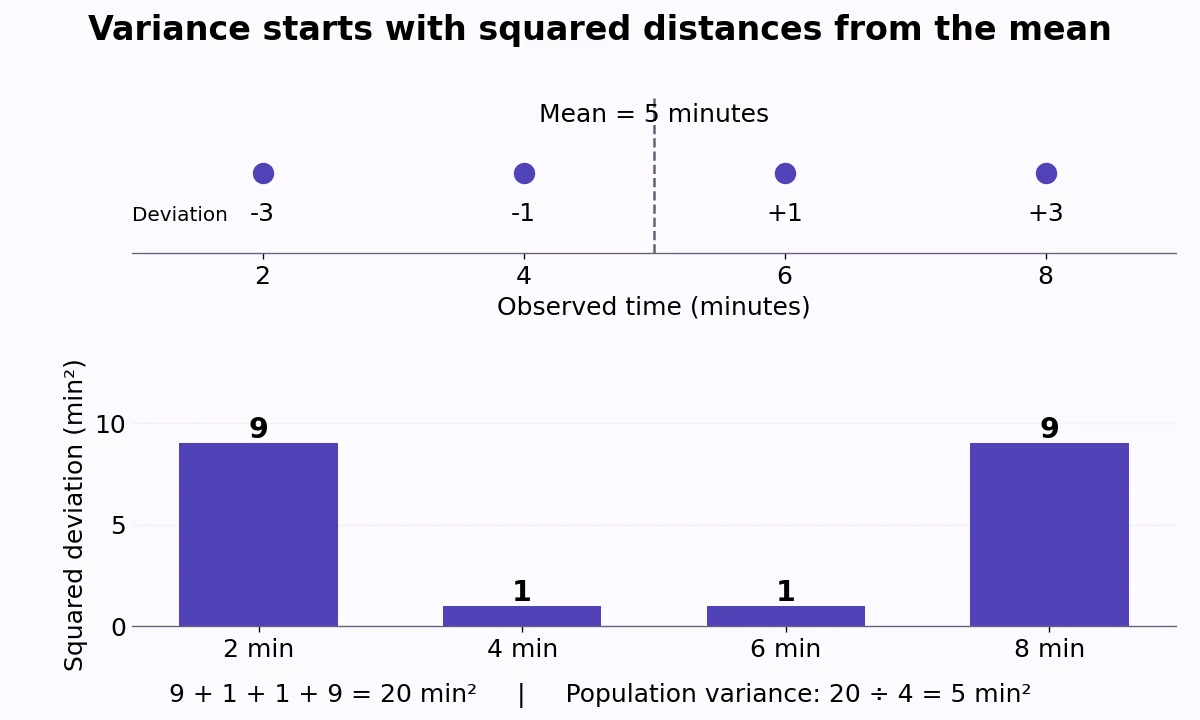
For example, suppose four recorded task times are 2, 4, 6, and 8 minutes. Their mean is 5 minutes. Their population variance is 5 square minutes, while their sample variance is about 6.67 square minutes. The different answers describe different statistical purposes, not different arithmetic.
Population variance and sample variance
Use population variance when the values are the entire population you want to describe. If these are all four task times in your chosen group, divide the squared-deviation total by 4.
Population variance: σ² = Σ(xᵢ − μ)² / N
Here, xᵢ is an individual value, μ is the population mean, N is the number of values, and Σ means to add the terms for every value.
Use sample variance when the observations form a sample used to estimate variability in a broader population. The conventional formula uses the sample mean, written x̄, and divides by n − 1:
Sample variance: s² = Σ(xᵢ − x̄)² / (n − 1)
The letter n counts the sample observations. Choose the formula according to what the data represent, rather than whether the list seems short or long. OpenStax explains the population and sample divisors in its treatment of spread.
How to calculate variance: a worked example
Start with the four times 2, 4, 6, and 8 minutes. Calculate their mean: (2 + 4 + 6 + 8) / 4 = 5 minutes. Subtract 5 from each time, then square each difference.
| Time (minutes) | Deviation (minutes) | Squared deviation (min²) |
|---|---|---|
| 2 | −3 | 9 |
| 4 | −1 | 1 |
| 6 | 1 | 1 |
| 8 | 3 | 9 |
Add the final column: 9 + 1 + 1 + 9 = 20 min². Now apply the appropriate divisor:
- Population variance: 20 / 4 = 5 min².
- Sample variance: 20 / (4 − 1) = 20/3 ≈ 6.67 min².
Both calculations use the same observations, mean, and squared-deviation total. Only the final divisor changes. Keep unrounded values through the calculation and round the final answer to the precision you need.
Why are the units squared?
Each deviation is a difference between two times, so it is measured in minutes. Squaring that difference produces square minutes, written min². A variance of 5 min² does not mean a typical difference of 5 minutes.
To return to the original units, take the square root. For our population example, √5 ≈ 2.24 minutes. For the sample example, √(20/3) ≈ 2.58 minutes. These are the corresponding standard deviations; see our standard deviation guide for further worked examples.
What does a larger variance mean?
When the observations use the same units and the same variance convention, a larger variance indicates greater spread around the mean. Compare like with like: converting minutes to seconds changes the numerical variance even though the underlying times stay the same.
There is no universal cutoff that makes a variance good or bad. For delivery times, less variability might mean more predictable service; for another question, variability may be the feature you want to study.
Squaring also increases the influence of distant observations. A deviation of 6 contributes 36 to the total, whereas a deviation of 3 contributes 9: twice the distance contributes four times as much. Check unusual values rather than automatically deleting them. NIST discusses how tail behavior affects measures of spread.
Can variance be zero or negative?
Variance cannot be negative. Every squared deviation is nonnegative, and the valid divisors are positive. If all observations are equal, their deviations are zero and so is their variance.
A population containing one value has variance zero. Sample variance requires at least two observations: with one value, n − 1 is zero, so that formula is undefined. These formulas summarize numerical observations; computing them does not require the data to follow a normal distribution.
Further reading
- MathBlogStandard Deviation: Formula and Worked ExamplesConnect variance with a measure in the original units.
- OpenStaxMeasures of the Spread of the DataReview population and sample calculations in an introductory textbook.
- NIST/SEMATECHMeasures of ScaleCompare variance with other descriptions of variability.