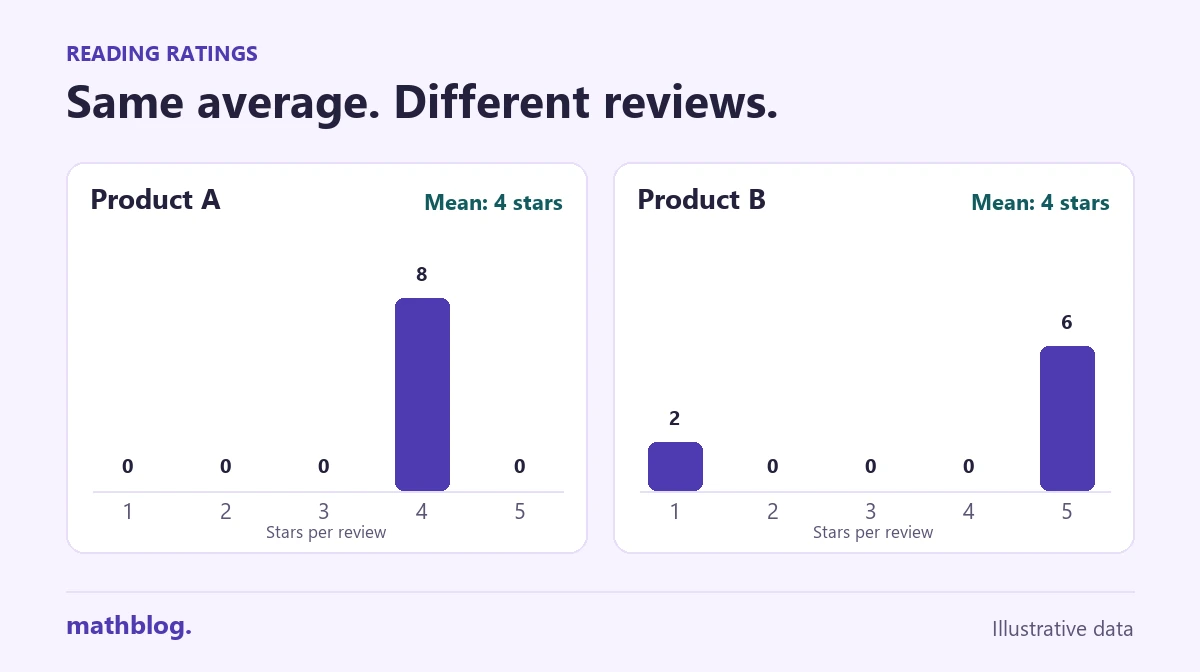
Two products can display the same four-star average and the same review count while their customers report very different experiences. Imagine each product has eight reviews. Everyone who reviewed Product A gave it four stars. Product B received six five-star reviews and two one-star reviews.
Both rating totals are 32 stars. Looking at the individual choices explains how two different sets of reviews arrive at the same number.
Where the four stars come from
For Product A, the arithmetic mean is \(\frac{8\times4}{8}=4\). For Product B, it is \(\frac{2\times1+6\times5}{8}=4\). Each calculation divides the total stars by the eight recorded reviews.
| Stars | Product A | Product B |
|---|---|---|
| 1 | 0 | 2 |
| 2 | 0 | 0 |
| 3 | 0 | 0 |
| 4 | 8 | 0 |
| 5 | 0 | 6 |
A four-star review is the only score Product A received. For Product B, four is an average of the scores, and no reviewer picked four stars. Keeping the review count beside the average is useful, but it still leaves the distribution out. Here the counts are equal, too.
Ask how often a score occurred
Suppose one-star reviews are the scores you want to investigate. Product A has none. Product B has two out of eight, or 25%. A tally like this answers a question the average cannot answer on its own.
You might also ask what rating falls in the middle. Put each product’s scores in order and take the mean of the fourth and fifth entries. Both middle entries are four for Product A and five for Product B, so their medians are four and five. The median describes the middle of the ordered scores. It can be read alongside the low-rating count, which describes one end of the list.
Keep the review counts in the comparison
A row of five bars can show the pattern quickly. Use the same vertical scale for both products so a bar of height two always represents two reviews. When the totals differ, give the total for each product and compare shares as well as counts. Two one-star reviews out of eight represent a larger share than two out of 80.
The table can help you decide where to read more. For Product B, the one-star reviews might describe the same failure or two unrelated problems. The score counts show the split in this group of reviewers, and the comments give it context. A useful summary puts the average, the number of reviews, and the rating breakdown together.