If collecting more observations improves an estimate, four times as many observations should make it four times as precise. For a sample mean under a standard independence model, that intuition grows too quickly.
The estimated standard error is s / √n. Holding the standard deviation fixed, quadrupling the sample size halves that standard error. It does not divide it by four.
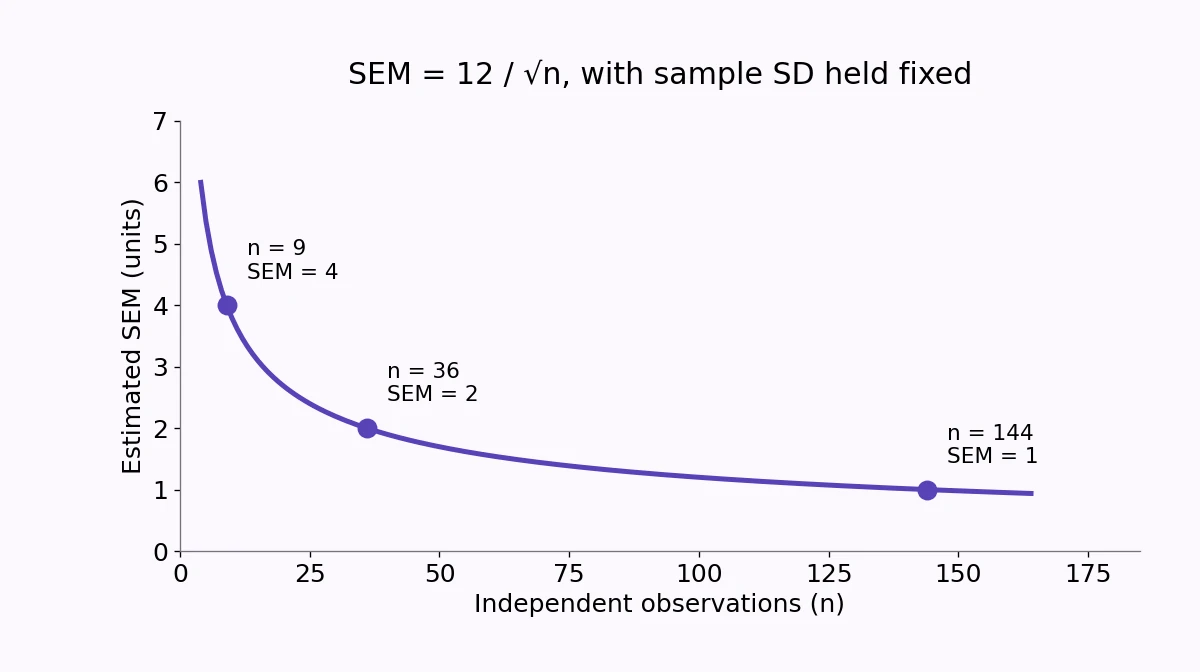
The square root sets the pace
Use an illustrative standard deviation of 12 units. With n = 9 independent observations, the estimated standard error of the mean is 12 / √9 = 4 units. With n = 36, it is 12 / √36 = 2 units.
Going from 9 to 36 observations multiplies n by four. Its square root only doubles, from 3 to 6. That is why the estimated standard error falls from 4 to 2.
If the aim is one quarter of the original standard error, the denominator must be four times as large. The sample size must therefore be 16 times as large: 9 × 16 = 144. Then 12 / √144 = 1 unit.
Define what you mean by precision
Here, better precision means a smaller standard error for an estimated mean. If precision is defined instead as inverse variance, the numerical scaling is different: the variance of an independent sample mean is σ²/n. Use the actual quantity rather than an ambiguous claim that an estimate became “four times better.”
Confidence-interval widths also involve a multiplier. For t intervals, that multiplier changes with the degrees of freedom, so their exact widths do not follow only the square-root ratio in a small sample. The SEM relationship isolates one important part of the calculation.
The variability is being held fixed
The table below keeps s at 12 to show the sample-size effect. A real new sample can have a different sample standard deviation. The calculated SEM could therefore differ from this illustration even if the model is appropriate.
| Observations | Square root of n | Estimated SEM |
|---|---|---|
| 9 | 3 | 4 |
| 36 | 6 | 2 |
| 144 | 12 | 1 |
Notice what does not shrink in the example: the SD of individual observations remains 12. More observations can improve the estimate of the population mean without making the individual measurements more alike.
More rows are not always more independent information
Duplicating every row four times creates a larger spreadsheet, not four times as much independent evidence. Closely related observations, repeated measurements, or clusters can require a different standard-error calculation.
More data also do not automatically fix a biased measurement or an unrepresentative sample. A narrow interval around the wrong target can be precise and misleading at the same time.
When planning additional data collection, state the target quantity, expected variability, and dependence assumptions. The square-root relationship is useful for understanding the pace of improvement. It is not a guarantee that every larger dataset is a better one.