Two charts show a mean of 50, but their error bars have very different lengths. Before deciding which result is more consistent or more precise, read what the bars represent.
A bar might show standard deviation, standard error, or a confidence interval. These are different summaries. Drawing each one around the same mean makes the distinction easier to see.
One hypothetical sample, three displays
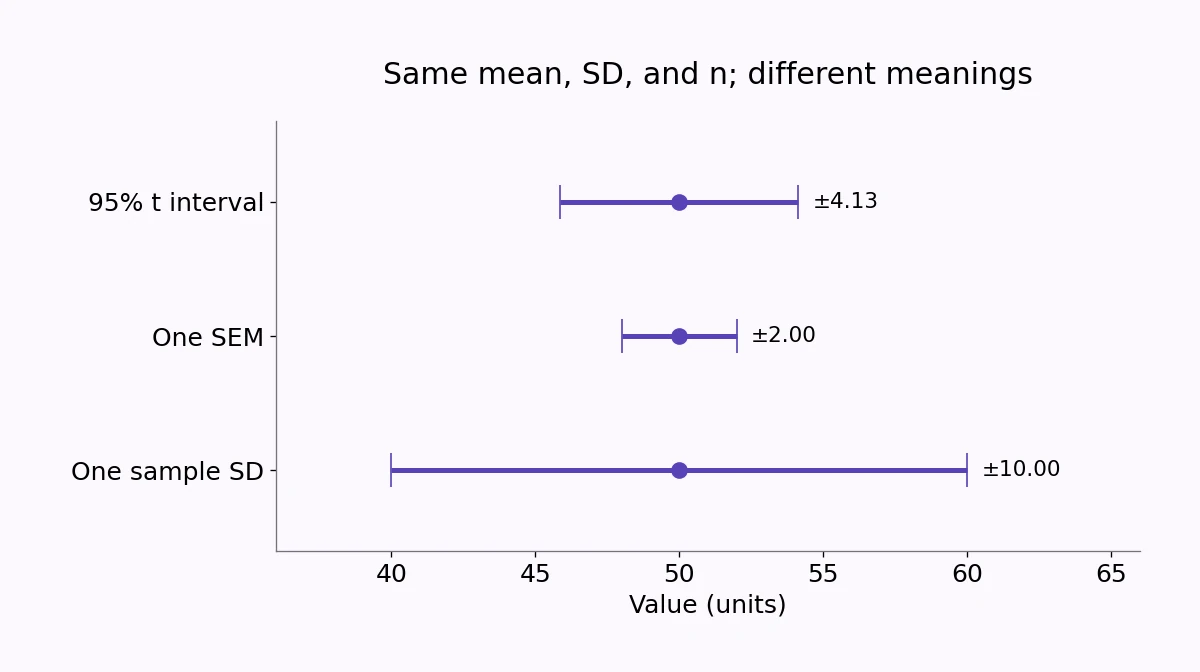
Suppose a sample has 25 observations, a mean of 50 units, and a sample standard deviation of 10 units. Assume independent observations from a normal population for the exact small-sample confidence interval below. These are illustrative summary values, not a measured study.
A standard-deviation bar extending one sample SD in each direction runs from 40 to 60. It describes variability among observations. It does not, without distributional assumptions, say that a particular percentage of observations must fall inside that interval.
The standard error of the mean is 10 / √25 = 2 units. A bar of plus or minus one SEM runs from 48 to 52. It describes estimated sampling uncertainty in the mean under the independence model, rather than the spread of individual observations.
A 95% interval needs another multiplier
For these normal-model assumptions and an unknown population standard deviation, a two-sided 95% confidence interval uses a Student t multiplier with 24 degrees of freedom. That multiplier is approximately 2.0639.
The margin is therefore 2.0639 × 2 ≈ 4.1278 units. The interval is approximately 45.8722 to 54.1278. A one-SEM bar would be much narrower; labeling it “95% confidence” would be wrong.
The familiar 1.96 multiplier belongs to a standard-normal construction. It is not automatically the correct multiplier for every sample mean, especially when a small sample supplies the estimate of variability.
| Bar type | Half-width | Endpoints |
|---|---|---|
| One sample SD | 10 | 40 to 60 |
| One SEM | 2 | 48 to 52 |
| 95% t interval | About 4.1278 | About 45.8722 to 54.1278 |
Read the sample size and assumptions
SEM depends on the sample size through s / √n. Two groups with the same observed variability but different counts can have different SEM bars. That does not imply that individual observations in the larger group are less spread out.
Repeated measurements on the same person or clustered records may not be independent. In that case, dividing by the square root of the raw row count may understate uncertainty. The design determines the appropriate analysis.
A useful caption names the quantity
Write “mean ± one sample SD” or “mean with two-sided 95% t confidence interval,” and include n. If bars show SEM, say so directly. An unlabeled bar leaves readers guessing about the main message of the chart.
A 95% confidence statement concerns the long-run coverage of a method under its assumptions. It is not a 95% probability assigned to a fixed population mean after this particular interval has been calculated. The label and the method belong together.