Two teams shorten their average completion times. Yet the organization’s average time more than doubles. That sounds like a spreadsheet mistake, but it can happen with perfectly consistent numbers.
The missing detail is how much work each team handles. An overall average combines both performance and the mix of observations. When that mix changes, the headline can move in the opposite direction from every group average.
Start with the work, not the team count
Imagine two teams processing the same broadly defined kind of job. Team A handles the more time-consuming work. These are invented figures, chosen to make the arithmetic visible; they are not evidence about an actual workplace.
| Team | Earlier jobs | Earlier mean time | Later jobs | Later mean time |
|---|---|---|---|---|
| A | 10 | 30 minutes | 90 | 28 minutes |
| B | 90 | 10 minutes | 10 | 8 minutes |
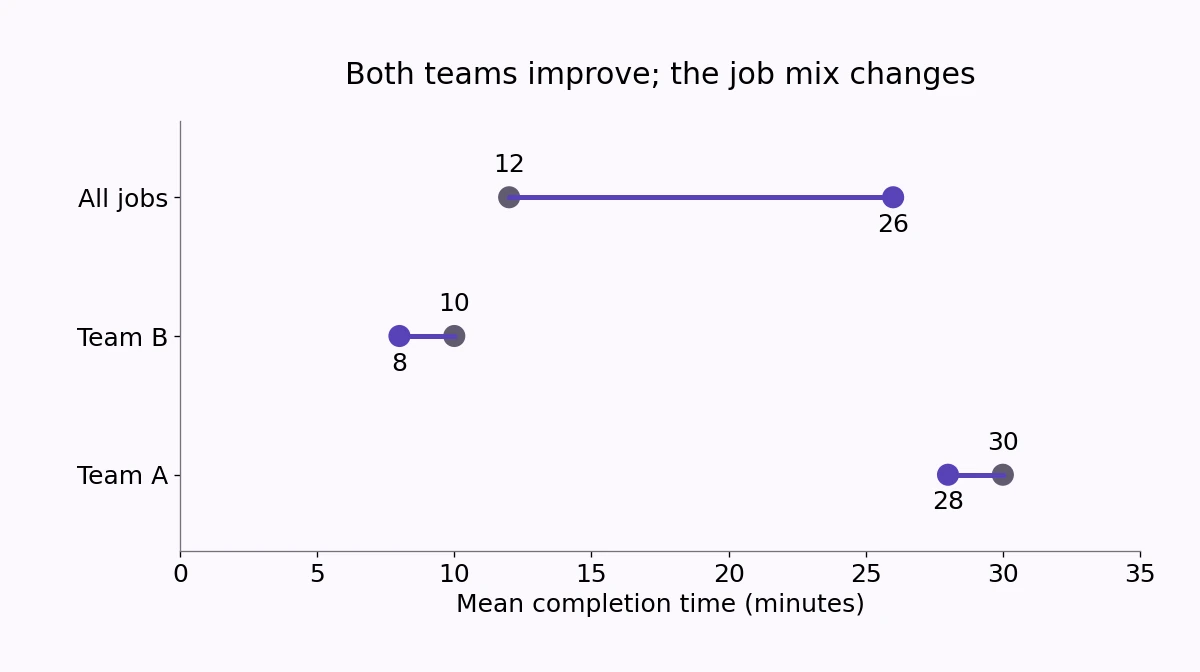
Team A’s average falls from 30 to 28 minutes. Team B’s falls from 10 to 8. Each team improves by two minutes per job. But the earlier period contains mostly Team B jobs, while the later period contains mostly Team A jobs.
The pooled average has different weights
Earlier, the total processing time is 10 × 30 + 90 × 10 = 1,200 minutes. Divide by 100 jobs to get 12 minutes per job.
Later, the total is 90 × 28 + 10 × 8 = 2,600 minutes. Divide by 100 again: 26 minutes per job. The arithmetic has not contradicted either team’s improvement. A larger share of the later jobs comes from the team with the higher average time.
Averaging the two team means directly would give 20 minutes earlier and 18 later. Those numbers describe an equal weighting of teams, not the average time experienced across the actual jobs. Both calculations can answer a question; they answer different questions.
Ask what the headline is meant to measure
If the question is “How long did the average job take in each period?”, the pooled figures of 12 and 26 are appropriate. If the question is “How did performance change while holding the team mix fixed?”, use the same weights in both periods.
For example, weighting each team at 50% gives 20 minutes earlier and 18 later. Keeping the earlier 10%/90% mix gives 12 minutes earlier and 10 later. Either fixed mix removes this particular composition change. The choice of standard mix should be stated rather than selected because it produces a preferred headline.
The arithmetic does not establish a cause
This example is a form of an aggregate reversal often discussed under Simpson’s paradox. It shows why group sizes matter. It does not show that every individual worker got faster, that the jobs were equally difficult across periods, or that a management change caused an improvement.
Before interpreting a changing average, keep the group counts beside the group means. Check whether definitions, job complexity, and coverage stayed comparable. Then report the pooled result and the within-group changes together. A single average can describe the total workload accurately while hiding the reason that total changed.