You enter the same six numbers into two calculators. Both return the same median, but their lower and upper quartiles differ. Before assuming one is broken, check which quartile rule each calculator uses.
Finite datasets do not always divide neatly into four equal parts. Several conventions turn ordered positions into quartile values. A method matters most when the dataset is small or a result sits near a decision boundary.
One list, two named methods
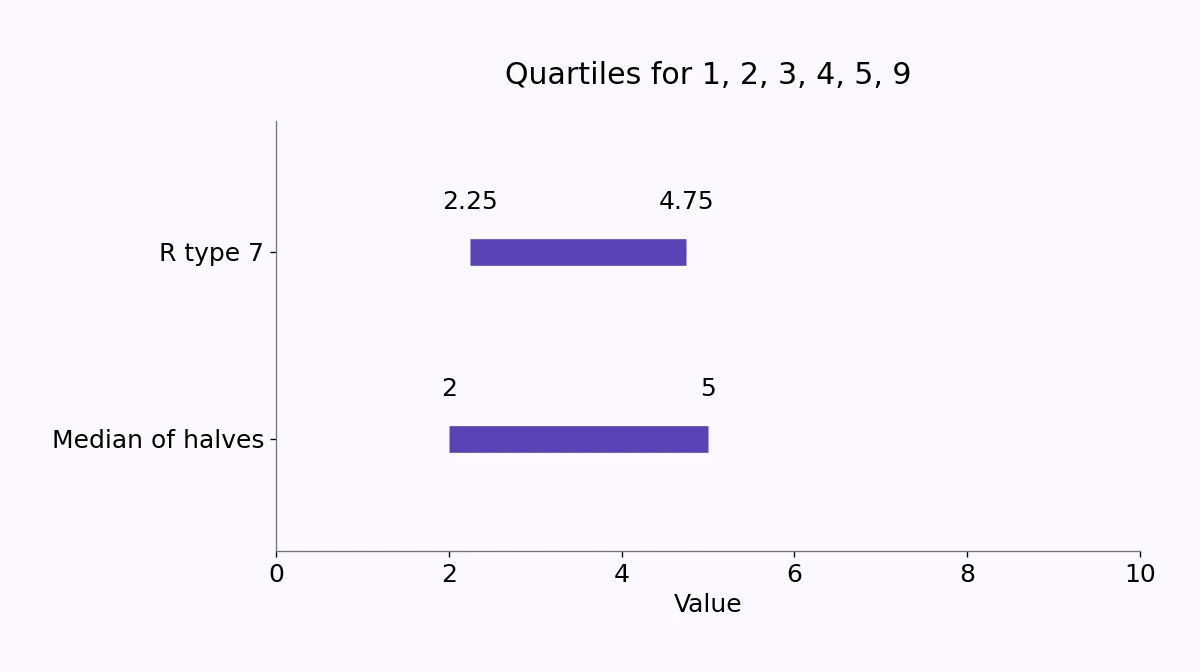
Use the ordered data 1 2 3 4 5 9. The median is (3 + 4) / 2 = 3.5. Now split the list into a lower half, 1, 2, 3, and an upper half, 4, 5, 9. Their medians give Q1 = 2 and Q3 = 5.
That is the median-of-halves method. For an odd number of observations, the version discussed here excludes the overall middle observation from both halves. Naming that detail prevents another common disagreement.
A second method uses linear interpolation, specifically R’s type 7 rule. At proportion p, its one-based rank is h = 1 + (n − 1)p. With six observations, the lower quartile rank is 2.25 and the upper quartile rank is 4.75.
Move one quarter of the way from the second value, 2, to the third, 3: Q1 = 2.25. Move three quarters of the way from the fourth value, 4, to the fifth, 5: Q3 = 4.75. These are interpolated summaries; they do not have to be observed values.
A different quartile can change an outlier flag
The interquartile range is Q3 − Q1. Median-of-halves gives 3, while type 7 gives 2.5. Apply the usual upper fence, Q3 + 1.5 × IQR: the first method gives 9.5; the second gives 8.5.
The observation 9 is inside the first fence and outside the second. Nothing about the observation changed. The rule used to label it did. A flag should start an investigation, not trigger automatic deletion.
| Method | Q1 | Q3 | IQR | Upper fence |
|---|---|---|---|---|
| Median of halves | 2 | 5 | 3 | 9.5 |
| R type 7 | 2.25 | 4.75 | 2.5 | 8.5 |
Match the method before comparing output
Record the algorithm, software function, and any option controlling interpolation. “The 25th percentile” alone may not reproduce the result. Check missing values, numeric text, and whether one program has filtered rows that another kept.
For homework, use the convention taught in the course. For a report, choose a defensible method, state it, and keep it consistent across groups and periods. Switching methods after seeing which observation gets flagged changes the analysis.
R documents nine sample-quantile algorithms and uses type 7 by default. That variety is a reason to be precise about the method, not a reason to regard quartiles as arbitrary. Once the inputs and rule are fixed, the calculation is reproducible.