A store’s most requested shoe size is 8. Ordering nothing but size 8 would still disappoint most customers in the small example below. “Most common” is not the same as “fits everyone,” or even “belongs to a majority.”
The mode is useful because it identifies a repeated favorite. The trouble starts when we ask it to describe individuals, an entire distribution, or a decision that needs more than one number.
A winner with less than half the observations
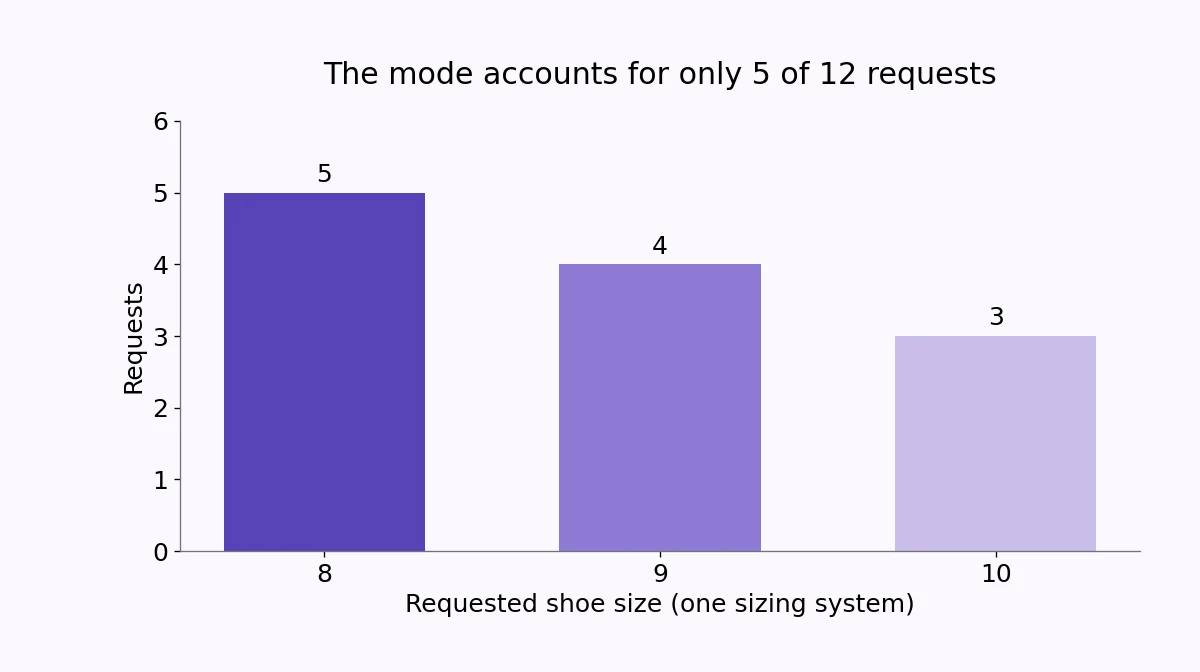
Suppose 12 hypothetical customers request sizes from one consistent sizing system: five request size 8, four request size 9, and three request size 10. Size 8 is the unique mode because its frequency, five, is the largest.
However, only 5/12, or about 41.7%, request that size. The other seven customers request something else. A category can be the largest single group without accounting for more than half of the total. That distinction is the difference between a plurality and a majority.
The same issue appears with the most selected survey response, the most common order quantity, or the most frequent support request. Knowing the leading category helps, but the size of its lead and the rest of the distribution still matter.
Three summaries, three questions
The numerical mean of the size labels is (5 × 8 + 4 × 9 + 3 × 10) / 12 = 8.8333…. It is an arithmetic summary of these labels, not a recommendation to manufacture or buy a shoe of exactly that size.
Sorting the 12 requests puts size 8 in positions 1 through 5, size 9 in positions 6 through 9, and size 10 in positions 10 through 12. The two middle observations, positions 6 and 7, are both 9. The median is 9.
The mean, median, and mode differ because each uses the observations differently. The mean balances the numeric labels; the median uses ordered positions; the mode counts repetitions. None of them preserves the full frequency table.
Do not force a unique mode
If five customers request size 8 and five request size 9, both are modes. Selecting whichever appears first in a spreadsheet would hide the tie. If every numerical value occurs once, many introductory treatments say there is no mode; state that convention when comparing software output.
For continuous measurements, exact repetitions can be rare. A histogram instead groups observations into intervals, and the interval with the largest count depends partly on the chosen bins. Its tallest bar is not automatically an exact modal measurement.
Keep the decision at the right level
An inventory planner needs the counts for all sizes, likely demand beyond this tiny example, and the cost of shortages and leftovers. A person choosing shoes needs their own fit. These are different decisions, and neither is solved by declaring one size “average.”
When someone presents a mode, ask for its count and the total count. “Size 8 was requested five times out of 12” is much more informative than “the typical size was 8.” Add the frequency table when the spread across categories affects what happens next.