Convert a weather log from Celsius to Fahrenheit and its average changes. So does its standard deviation. Its variance changes by yet another factor, even though every entry still describes the same temperature.
The reason is hidden in the two operations that make up the conversion: multiplying by 1.8 and adding 32. Those operations have different effects on a dataset’s center and spread.
One log, two sets of numbers
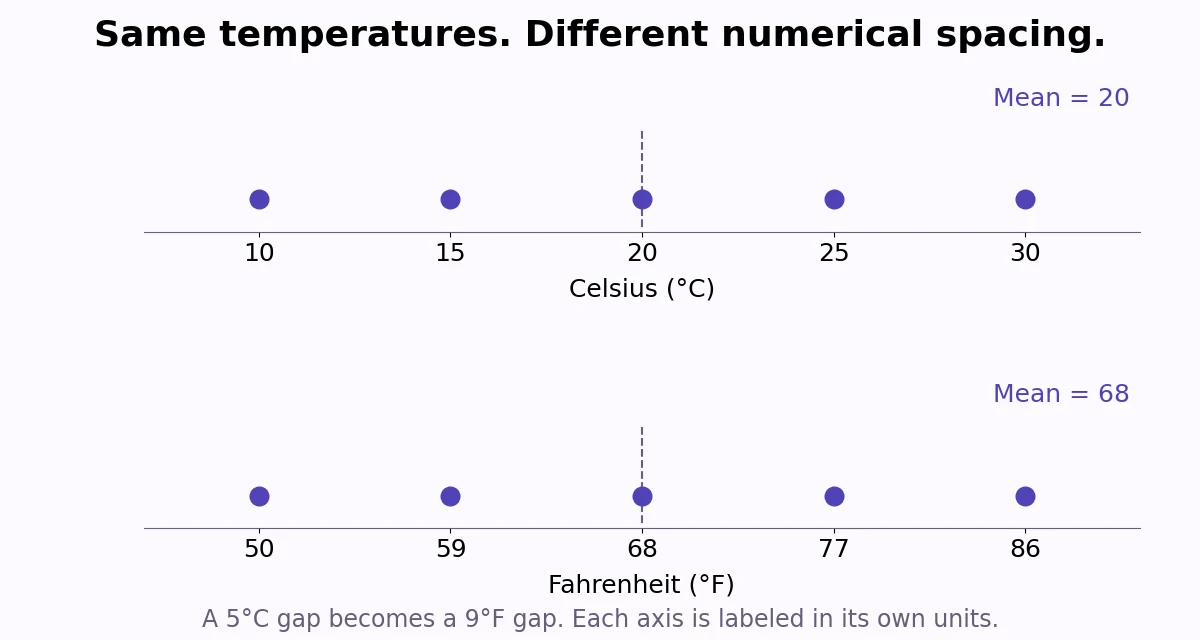
Suppose a sensor records these five temperatures. The NIST temperature conversion gives Fahrenheit as 1.8 times Celsius, plus 32.
| Reading | Celsius (°C) | Fahrenheit (°F) |
|---|---|---|
| 1 | 10 | 50 |
| 2 | 15 | 59 |
| 3 | 20 | 68 |
| 4 | 25 | 77 |
| 5 | 30 | 86 |
The Celsius mean is 20. Applying the conversion to that mean gives 1.8 × 20 + 32 = 68, which is also the mean of the Fahrenheit readings.
Now subtract each mean from its readings. In Celsius, the deviations are −10, −5, 0, 5, and 10. In Fahrenheit, they are −18, −9, 0, 9, and 18. Every deviation is 1.8 times as large. The added 32 has disappeared.
Why the offset disappears
Adding 32 moves every number, including the mean, by the same amount. It does not change the distance from an observation to that mean.
Multiplying by 1.8 does change those distances. Squaring the deviations then multiplies them by 1.8² = 3.24. That is why the variance changes by 3.24 while the standard deviation changes by 1.8.
For a general conversion y = ax + b, the transformed mean is a times the original mean, plus b. The variance is multiplied by a²; the standard deviation is multiplied by |a|. The absolute value matters because a spread cannot be negative, even when a transformation reverses the scale.
Keep the population or sample convention consistent
If these five readings are the entire set we want to describe, divide the sum of squared deviations by 5. If they are a sample used to estimate a broader population’s variability, the usual sample formula divides by 4. Our standard deviation guide works through that distinction.
| Summary | Celsius | Fahrenheit |
|---|---|---|
| Mean | 20 °C | 68 °F |
| Population variance | 50 °C² | 162 °F² |
| Population standard deviation | 7.071068 °C | 12.727922 °F |
| Sample variance | 62.5 °C² | 202.5 °F² |
| Sample standard deviation | 7.905694 °C | 14.230249 °F |
The scaling rule holds with either convention. Comparing a Celsius sample result with a Fahrenheit population result would mix two changes at once.
A unit change is not a change in the weather
The Fahrenheit standard deviation has a larger numerical value because a Fahrenheit degree is a smaller interval. The sensor has not become less consistent. Any report comparing spreads needs to state the units and use a common scale.
Celsius to kelvin offers a useful contrast: add 273.15 to each reading, with no multiplication. The mean changes, but the numerical standard deviation and variance remain the same. Temperature differences of one kelvin and one degree Celsius have equal size.
Nor does dividing 68 by 20 tell us that one temperature is 3.4 times as hot. These two means describe the same temperatures in scales with different zero points. For this log, the meaningful comparison is the converted center and spacing, with the units attached.