Three observations can agree perfectly even when the process producing them is quite variable. A small sample may simply miss the part of the distribution that would change the picture.
A jar containing four tickets makes this problem easy to see. It also explains why a standard deviation of zero deserves some context before it becomes a claim about the world.
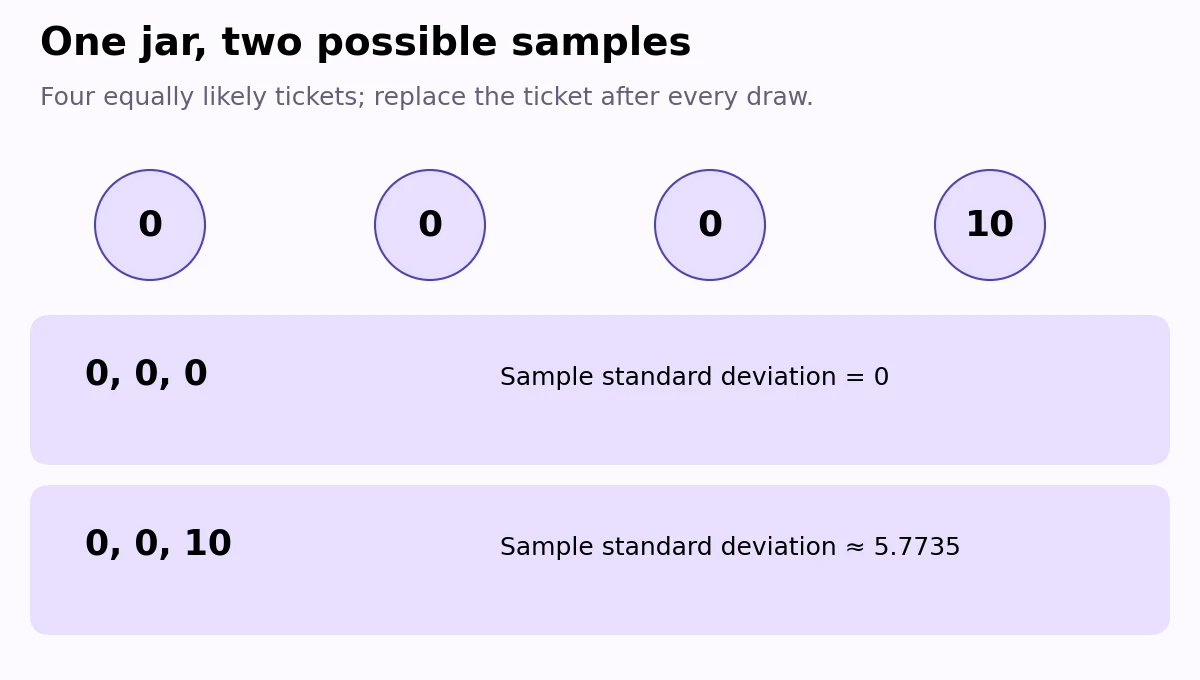
The same jar can produce very different summaries
The tickets are labeled 0, 0, 0, and 10. Draw one, record its value, replace it, and mix before drawing again. Every independent draw has a 3/4 chance of producing 0 and a 1/4 chance of producing 10.
One three-draw sample might be 0, 0, 0. Its mean is zero, and so is its sample standard deviation. Another might be 0, 0, 10. Its mean is 10/3, or about 3.3333, and its sample standard deviation is about 5.7735.
| Sample | Mean | Sample variance | Sample standard deviation |
|---|---|---|---|
| 0, 0, 0 | 0 | 0 | 0 |
| 0, 0, 10 | 10/3 ≈ 3.3333 | 100/3 ≈ 33.3333 | 5.7735 |
The jar itself has a mean of 2.5 and a population standard deviation of about 4.3301. Neither sample result changes the jar. Each tells us about a short run of observations from it.
Missing the 10 is not especially unlikely
To get no 10s in three draws, we need a zero on every draw. With replacement and independent draws, multiply the probabilities:
P(no 10 in three draws) = (3/4)³ = 27/64 = 42.1875%.
That is a substantial chance of seeing nothing but zeros, despite the process having a genuine possibility of producing 10. Zero sample spread does not establish zero population spread.
With 20 draws, the chance of missing 10 throughout becomes (3/4)²⁰, or about 0.3171%. A larger independent sample makes this particular blind spot less likely. It does not make it impossible.
These probabilities refer specifically to missing 10. They are not the full probability of getting a standard deviation of zero: a sample containing only 10s would also have zero spread.
Dividing by n − 1 does not repair a missed value
The usual sample standard deviation calculation divides the squared-deviation total by n − 1 before taking a square root. For 0, 0, 0, every squared deviation is zero. Changing the divisor cannot supply a value that was never observed.
For 0, 0, 10, the squared-deviation total is 200/3. Dividing by 2 gives a sample variance of 100/3, and taking its square root gives about 5.7735. This estimate exceeds the jar’s population standard deviation. A sample can overestimate spread as well as underestimate it.
More data helps only if the collection method helps
The jar example has a clear sampling rule. In real data, observations may come from one convenient time of day, one customer group, or one production line. Repeating that selection many times does not automatically represent the people or conditions left out.
Before interpreting a small-sample result, ask how the observations were collected, which outcomes might be missing, and whether unusual values are plausible. In this jar, 10 is a legitimate outcome. Deleting it because it looks different would remove information about the process.
Also separate two questions: how spread out are the observations, and how uncertain is their estimated mean? Standard deviation addresses the first. It should not automatically shrink as the sample grows; more observations may reveal spread that a short run missed.
Report the number of observations alongside the spread, and keep the actual values visible when the list is short. A standard deviation is a summary of evidence. With only three observations, the evidence can leave a great deal unseen.