A single observation sits far from the rest of your data. Removing it makes the chart cleaner and changes the average. Neither fact, by itself, tells you whether removing it is justified.
An unusual value might be a typing mistake, a measurement problem, or a real event your analysis needs to include. Start with its origin and the question you are trying to answer, rather than the result you would like to report.
1. Is the recorded value wrong?
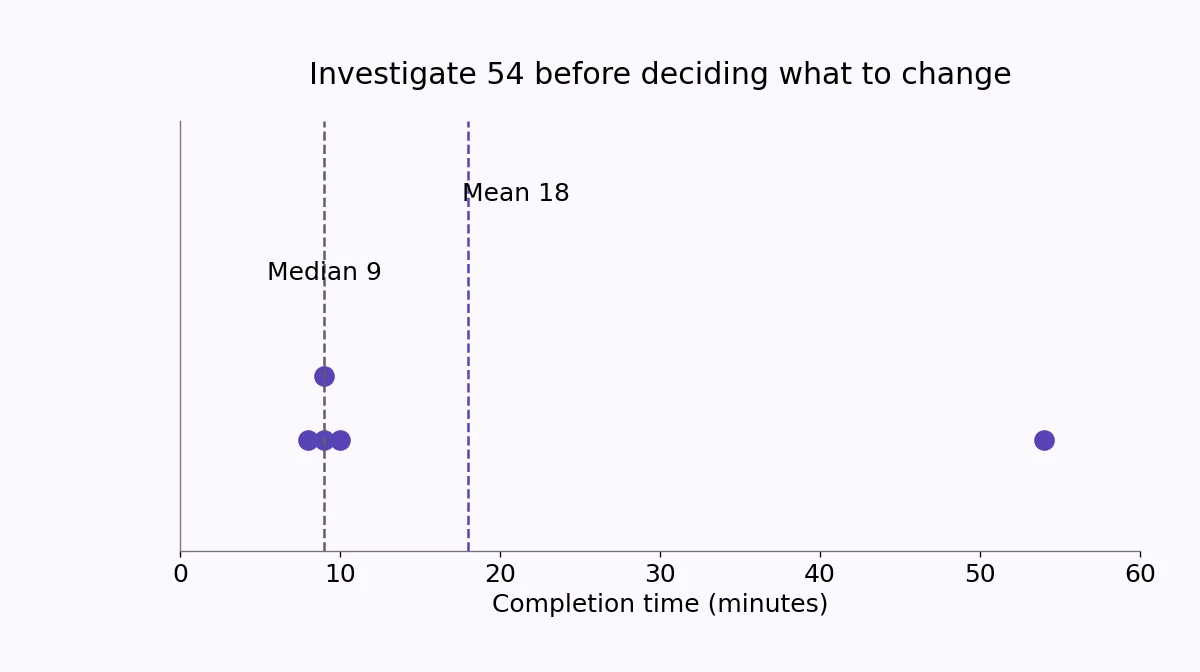
Suppose recorded completion times are 8 9 9 10 54 minutes. The value 54 deserves a look. Check the original record: was it 5.4 minutes, 54 seconds, or genuinely 54 minutes? Did the timer include a break? Are all five records measuring the same thing?
A verified transcription or unit error can often be corrected. Preserve the source and record the correction. If the original value cannot be recovered, explain how the missing or unreliable observation is handled rather than quietly replacing it with a convenient number.
A rule such as “anything over 30 is wrong” needs a substantive reason. If long jobs are possible, the cutoff could remove exactly the cases the analysis is meant to understand.
2. Is the value valid but unusual?
If 54 minutes is real, it belongs in a description of those five jobs. The mean is 90 / 5 = 18 minutes; the median is 9 minutes. Both are correct, and their difference is useful information.
Without the long job, the mean would be 36 / 4 = 9 minutes. That is a description of a different set of jobs. It should not be presented as the average for all five.
For capacity planning, a valid long job may be especially important because it consumes real time. For describing the middle of the distribution, the median may communicate something different and useful. Choosing a suitable summary can be more honest than removing an inconvenient observation.
3. Does the analysis require a different model?
Counts, waiting times, and transaction amounts can have asymmetric distributions. A long upper tail is not automatically contamination. A model that assumes a roughly symmetric cloud may be the wrong starting point.
NIST distinguishes labeling a possible outlier, accommodating its effect with an appropriate method, and formally identifying outliers under assumptions. A boxplot flag is a useful screening device. It is not a universal test of whether a value is false.
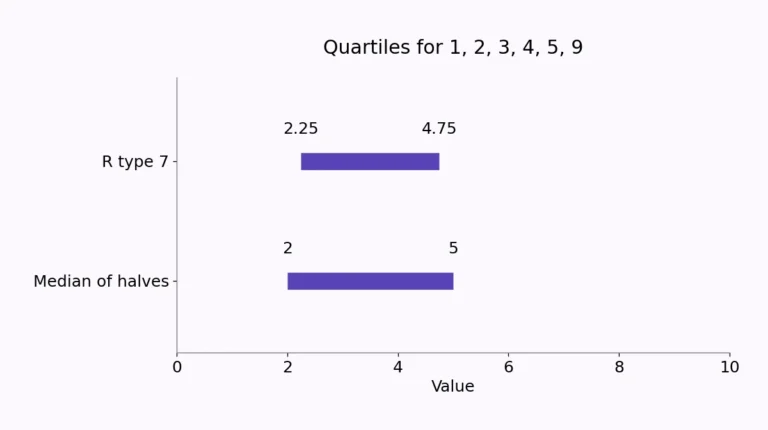
For example, a 1.5 × IQR fence depends on the quartile convention. In a small sample, changing that convention can change a flag. Investigate the observation and the data-generating process before applying a deletion rule.
Show the consequence of the choice
If there is a justified exclusion, report the reason, the number of observations removed, and the effect on the result. When the decision is uncertain, a clearly labeled sensitivity comparison can show results with and without the observation, while preserving the main dataset.
A short note such as “one verified duplicate record was removed” is auditable. “Outliers were cleaned” hides the decision. Keep a record of the rule and apply it consistently, including when a flagged observation supports the result you hoped to find.