Five deliveries take 3, 4, 5, 6, and 7 minutes. Their average time is 5 minutes, and their median is also 5 minutes. Now imagine that the last delivery takes 57 minutes instead of 7.
The new mean is 15 minutes. The median remains 5.
That difference is a clue about what the two summaries measure. One responds to the magnitude of every value; the other depends on the middle position in the ordered list.
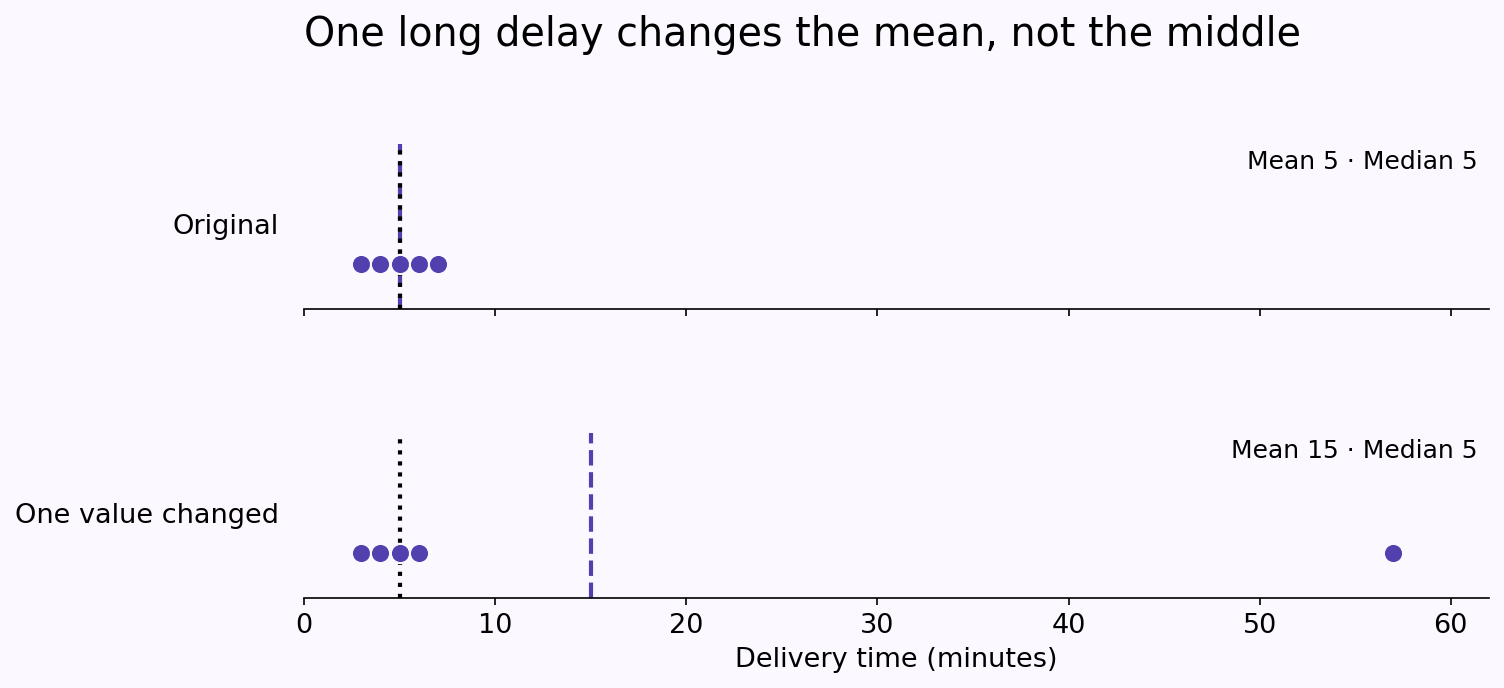
One change, two different results
For the original hypothetical delivery times,
\[\text{Mean}=\frac{3+4+5+6+7}{5}=5.\]
Replacing 7 with 57 adds 50 minutes to the total, giving
\[\text{New mean}=\frac{3+4+5+6+57}{5}=15.\]
The mean increases by \(50/5=10\) minutes. It spreads the additional time across all five observations.
The median is the third value in a sorted list of five values. Both lists have 5 in that position, so both medians are 5 minutes. Making the largest value still larger does not move the middle observation.
The mean has not made an arithmetic mistake
Four of the five delivery times are below the new mean of 15 minutes. That may feel odd, but a mean is not required to split a dataset into equally sized halves.
The total time is 75 minutes. If the task is to distribute that total evenly among five deliveries, 15 minutes per delivery is exactly the correct allocation.
This property makes the mean valuable for totals, workloads, and other additive quantities. It also explains why a few very large observations can pull it away from where most observations lie.
The median answers a position question
At least half of a dataset’s observations are no greater than its median, and at least half are no less. With an odd number of sorted observations, the median is the middle value. With an even number, the usual numerical convention averages the two central values.
The median does not generally discard the largest and smallest observations and then average everything left. That operation would be a form of trimmed mean, which is a different statistic.
Nor is the median completely immune to changes in data. If values move across the middle ranks, or enough unusual observations are added, the median can change. Its resistance to the exact size of a few extremes is a more precise claim than “outliers never affect the median.”
Which summary should you report?
The question determines the useful summary. For our delivery example:
- How much total time was spent per delivery on average? The mean connects directly to the total: 75 minutes divided by 5 deliveries.
- Where is the middle delivery in the ordered set? The median answers that question: 5 minutes.
- How unpredictable were delivery times? Neither center alone is enough. Report the spread or show the observations.
A mean of 15 and a median of 5 can both be worth reporting. Their difference suggests that a symmetric, tightly clustered description would miss something important.
Investigate the unusual observation
The 57-minute value might be a data-entry error, an exceptional delay, or a genuine part of the process. The arithmetic cannot tell us which.
Do not delete it merely because it changes the mean. Check the record and decide whether it belongs to the population being described. If it does belong, an analysis that hides it could omit precisely the kind of delay readers need to understand.
If a correction or exclusion is justified, explain the rule and its effect on the result. A transparent decision is more useful than silently choosing whichever average looks better.
Show more than one number
For a small dataset, publishing the five observations can be more informative than debating one “best” average. For a larger dataset, a distribution plot, selected percentiles, or a measure of spread can reveal information that the center conceals.
When you next see a reported average, ask what kind it is, how the data are distributed, and whether the reported number answers your question. The mean and median are tools for different parts of that investigation.
Further reading
- MathBlog · ArithmeticHow to find the meanFollow the calculation that gives every observation equal weight.
- MathBlog · ArithmeticHow to find the medianLocate the middle value in odd and even-sized datasets.
- OpenStax · Introductory StatisticsMeasures of the center of the dataCompare the mean and median and how they respond to extreme values.