Use DataFrame.melt() to turn repeated measurement columns into rows in pandas. Keep the identifying columns with id_vars, select the columns to reshape with value_vars, and name the resulting variable and value columns explicitly.
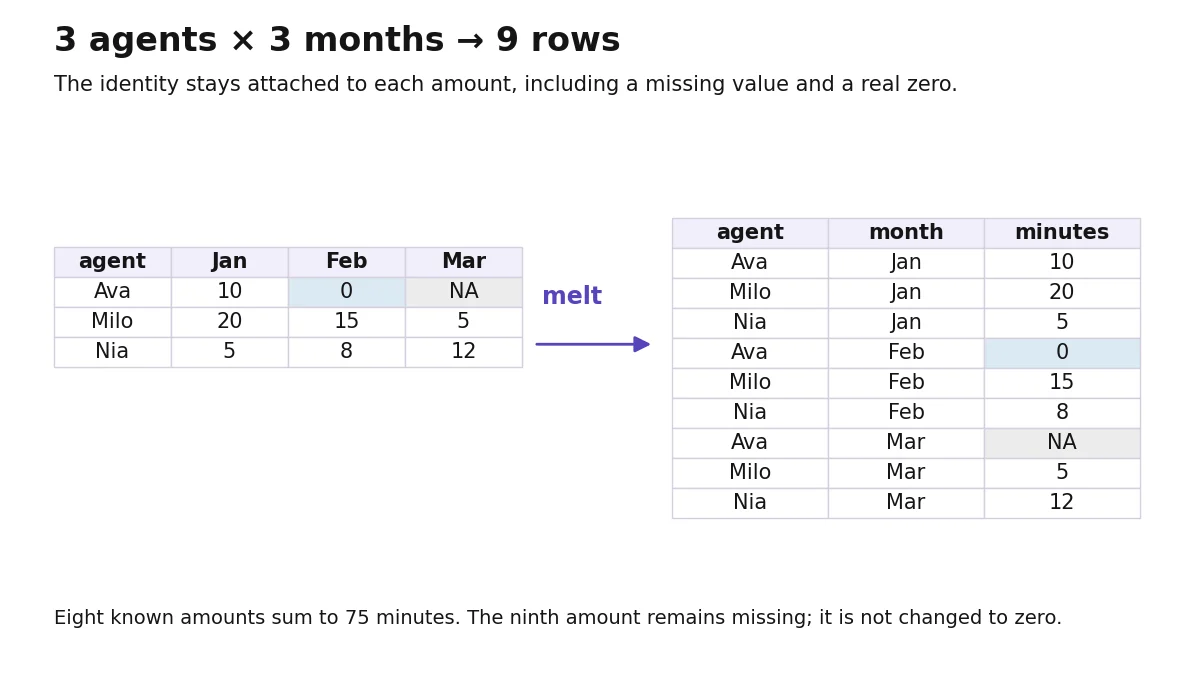
This example turns three agents’ monthly activity into nine agent-month records. It keeps a genuine zero and a missing amount distinct, checks the keys, and reshapes back to confirm that the values have stayed with the right people and months.
Start with one identifier and three month columns
Run the blocks in order in a Python session with pandas installed. All input data is included inline; you do not need a file or a service account. The example was executed with Python 3.11.3 and pandas 2.3.3. The linked current pandas documentation describes the same arguments, but printed dtypes can vary across versions and backends.
Here each number is a hypothetical number of minutes. Ava’s February 0 means no minutes were recorded for that activity. Her missing March amount means the amount is unknown; it does not mean zero.
| agent | Jan | Feb | Mar |
|---|---|---|---|
| Ava | 10 | 0 | missing |
| Milo | 20 | 15 | 5 |
| Nia | 5 | 8 | 12 |
import pandas as pd

wide = pd.DataFrame({
    "agent": ["Ava", "Milo", "Nia"],
    "Jan": [10, 20, 5],
    "Feb": [0, 15, 8],
    "Mar": [None, 5, 12],
})
assert wide["agent"].is_unique
print(wide.to_string(index=False, na_rep="NA"))
Output from the tested runtime:
agent  Jan  Feb  Mar
  Ava   10    0   NA
 Milo   20   15  5.0
  Nia    5    8 12.0
None becomes a missing numeric value in this example. The float display in March is a consequence of the inferred dtype, not a change in the unit. We print missing values as NA so that the output does not confuse them with an empty string.
Melt only the columns you intend to reshape
months = ["Jan", "Feb", "Mar"]
long = wide.melt(
    id_vars=["agent"],
    value_vars=months,
    var_name="month",
    value_name="minutes",
)
print(long.to_string(index=False, na_rep="NA"))
The result is:
agent month  minutes
  Ava   Jan     10.0
 Milo   Jan     20.0
  Nia   Jan      5.0
  Ava   Feb      0.0
 Milo   Feb     15.0
  Nia   Feb      8.0
  Ava   Mar       NA
 Milo   Mar      5.0
  Nia   Mar     12.0
agent is repeated for each selected month. The old month headings become values in month; their cell contents become minutes. The output has \(3\times3=9\) rows, arranged month by month in this example. Melting changes the representation, not the meaning or sum of the amounts.
Supplying value_vars is a useful safeguard. If you later add an office column and omit this argument, pandas will also try to melt that non-identifier column. A descriptive field can then become a supposed month and mix text with your numbers.
Check the keys, the missing value, and the zero
assert len(long) == len(wide) * len(months)
assert not long.duplicated(["agent", "month"]).any()
assert long["minutes"].isna().sum() == 1
assert long["minutes"].eq(0).sum() == 1
assert long["minutes"].sum() == 75

print("Rows:", len(long))
print("Missing amounts:", int(long["minutes"].isna().sum()))
print("Numeric zeros:", int(long["minutes"].eq(0).sum()))
print("Known total:", long["minutes"].sum())
Expected checks:
Rows: 9
Missing amounts: 1
Numeric zeros: 1
Known total: 75.0
The pair (agent, month) identifies an observation here. It is unique because each source agent has one row and each selected month occurs once. If the real source has several records for one agent, include the actual row-level identifier in id_vars; do not silently drop repeated records to force uniqueness.
The 75-minute sum covers the eight known amounts. It is not evidence that the unknown ninth amount was zero or that the complete real-world total was 75. The missing count preserves that warning. Avoid fillna(0) unless your data definition actually makes missing equivalent to zero.
Reshape back as a useful consistency check
back = long.pivot(index="agent", columns="month", values="minutes")
back = back.reindex(index=wide["agent"], columns=months)
print(back.to_string(na_rep="NA"))

assert back.loc["Ava", "Feb"] == 0
assert pd.isna(back.loc["Ava", "Mar"])
expected = wide.set_index("agent")[months]
expected.columns.name = "month"
pd.testing.assert_frame_equal(back, expected, check_dtype=False)
The reconstructed values are:
month   Jan   Feb   Mar
agent
Ava    10.0   0.0    NA
Milo   20.0  15.0   5.0
Nia     5.0   8.0  12.0
reindex puts the agents and months back in the intended order. A zero stays zero and the missing March amount stays missing. This checks the relationship between the identifier, month, and amount rather than merely comparing a grand total.
pivot requires a unique agent-month key and raises an error when a pair has multiple values. That is useful protection. If repeated observations are legitimate, decide what operation you need before using an aggregating pivot table. Summing duplicated rows simply to remove an error can change the question.
Keep labels and measurements separate
Use stable identifiers, select the intended measurement columns, and check the output row count before building a chart or summary. The default ignore_index=True creates a new index; use actual identifier columns rather than relying on the original index to identify each observation.
For the opposite reporting task, see our pandas pivot-table tutorial. A wide report is convenient for reading across a row; a long table is often easier to filter, group, and plot. Choose the representation that serves the next operation while keeping the underlying records intact.
Further reading
- pandas documentationpandas.meltCheck identifier columns, value columns, output names, and index handling.
- pandas documentationReshaping and pivot tablesCompare unpivoting with other reshaping operations.
- pandas documentationDataFrame.pivotSee the unique-key requirement and the difference from aggregation.
- pandas documentationWorking with missing dataUnderstand missing numeric values and dtype-dependent representations.