Create a pivot table in pandas with DataFrame.pivot_table(), then state exactly how repeated records should be combined. For a sales total, that usually means aggfunc="sum". An average answers a different question, even when the resulting table has the same row and column labels.
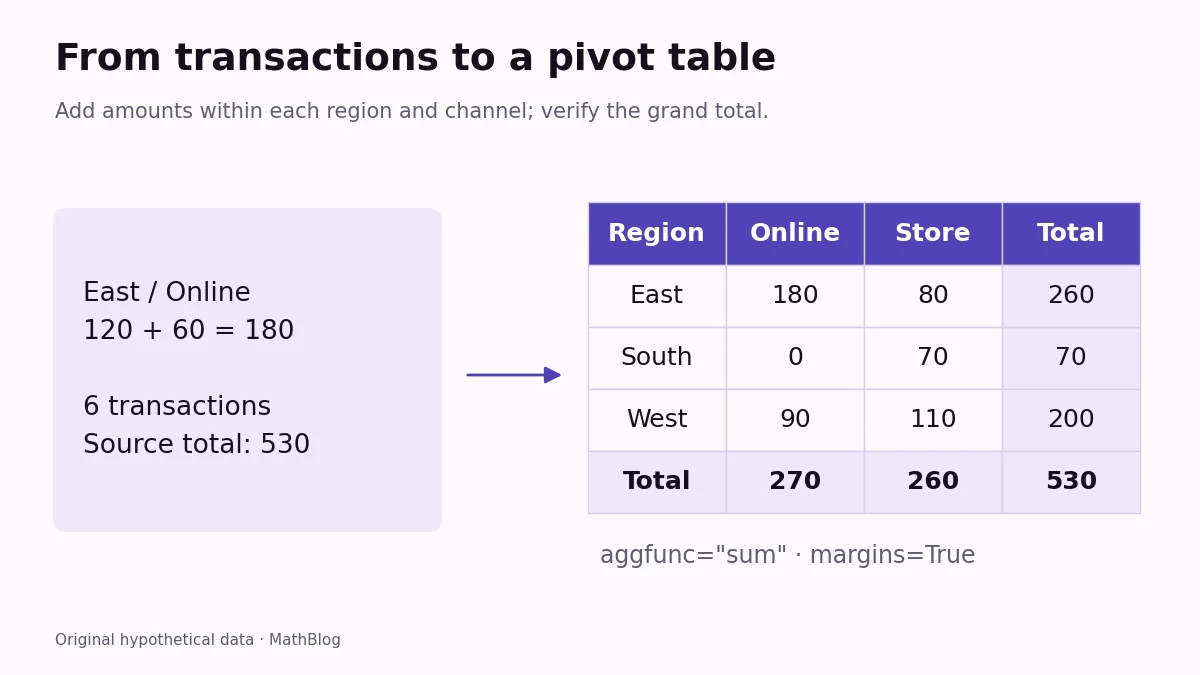
Our small hypothetical sales log has six transactions, three regions, and two channels. We will turn it into a compact comparison table, include totals, and check that the summary still accounts for all 530 units of sales in the original records.
Prepare a simple transaction table
Run these blocks in order in a Python session with pandas installed. The dataset is included directly in the code. Each row represents one transaction, and each amount is an integer in the same unit. There are no missing amounts or missing category labels in this example.
import pandas as pd

sales = pd.DataFrame({
    "region": ["East", "East", "East", "West", "West", "South"],
    "channel": ["Online", "Store", "Online", "Online", "Store", "Store"],
    "amount": [120, 80, 60, 90, 110, 70],
})
print(sales.to_string(index=False))
Expected source table:
region channel  amount
  East  Online     120
  East   Store      80
  East  Online      60
  West  Online      90
  West   Store     110
 South   Store      70
East/Online appears twice, with amounts of 120 and 60. That is useful information rather than an accidental duplicate: the two rows are separate transactions. We want both included in the East/Online total.
Choose rows, columns, values, and aggregation
Use regions as the row labels, channels as column labels, and amount as the measurement. The aggregation rule tells pandas what to do when several source rows belong to one cell.
summary = sales.pivot_table(
    index="region",
    columns="channel",
    values="amount",
    aggfunc="sum",
    fill_value=0,
    margins=True,
    margins_name="Total",
    observed=True,
    sort=True,
)
print(summary.to_string())
Expected pivot table:
channel  Online  Store  Total
region
East        180     80    260
South         0     70     70
West         90    110    200
Total       270    260    530
Read the result one cell at a time. East/Online is 120 + 60 = 180, and East/Store is 80, making the East total 260. West contributes 90 + 110 = 200. South contributes its single Store transaction of 70. The grand total is therefore 260 + 200 + 70 = 530.
The margins arguments add the total row and column. sort=True makes label ordering explicit. observed=True controls which categorical groups are included if you later use categorical dtypes, avoiding dependence on a version’s default setting.
Check whether you wanted totals or averages
Always name the aggregation explicitly. The default aggregation for pivot_table() is a mean, so leaving out aggfunc="sum" would silently answer a different question here.
average = sales.pivot_table(
    index="region", columns="channel", values="amount",
    aggfunc="mean", observed=True, sort=True,
)
print("East / Online total:", summary.loc["East", "Online"])
print("East / Online average:", average.loc["East", "Online"])
print("Source total:", sales["amount"].sum())
print("Pivot grand total:", summary.loc["Total", "Total"])
Expected checks:
East / Online total: 180
East / Online average: 90.0
Source total: 530
Pivot grand total: 530
The East/Online average is 90 because (120 + 60) / 2 = 90. The total is 180 because both transaction amounts are added. Neither calculation is inherently wrong; the mistake is presenting one as the other.
Also avoid summing every number in a pivot table that already contains margins. The same amounts appear in both the interior cells and the total row or column. Compare the source sum with the single grand-total cell instead.
Understand zeros and missing combinations
South has no Online transaction in this miniature log. We used fill_value=0 because the example treats the log as complete for the reporting period: no recorded sale in that combination contributes zero to the total.
That assumption may not fit an incomplete export. A missing combination could mean that a store failed to report, rather than that it sold nothing. Remove the fill rule if an empty cell should remain visibly unknown. Inspect missing category labels and amounts before summarizing; do not rely on a pivot table to resolve a data-quality problem for you.
Turn the index back into a regular column
The region labels currently form the index. If another step expects a conventional table with region as a column, reset the index. Removing the column-axis name also makes a plain text display easier to read.
flat = summary.rename_axis(columns=None).reset_index()
print(flat.to_string(index=False))
Expected flat table:
region  Online  Store  Total
  East     180     80    260
 South       0     70     70
  West      90    110    200
 Total     270    260    530
Use pivot() when every row/column key pair is already unique and you only want to rearrange values. It cannot decide how to combine our two East/Online transactions. pivot_table() can, because we supplied an aggregation rule.
These blocks were executed with Python 3.11.3 and pandas 2.3.3, including the duplicate-key and total checks. Explore the Python tutorials for other practical ways to prepare data before building a summary.