Use a complete date index to expose missing days in a pandas table. The workflow below creates one row for each date in a stated reporting window, preserves recorded zeros, and keeps unknown values missing.
The example uses original hypothetical order counts. Everything is inline and copyable; no workbook or data download is needed.
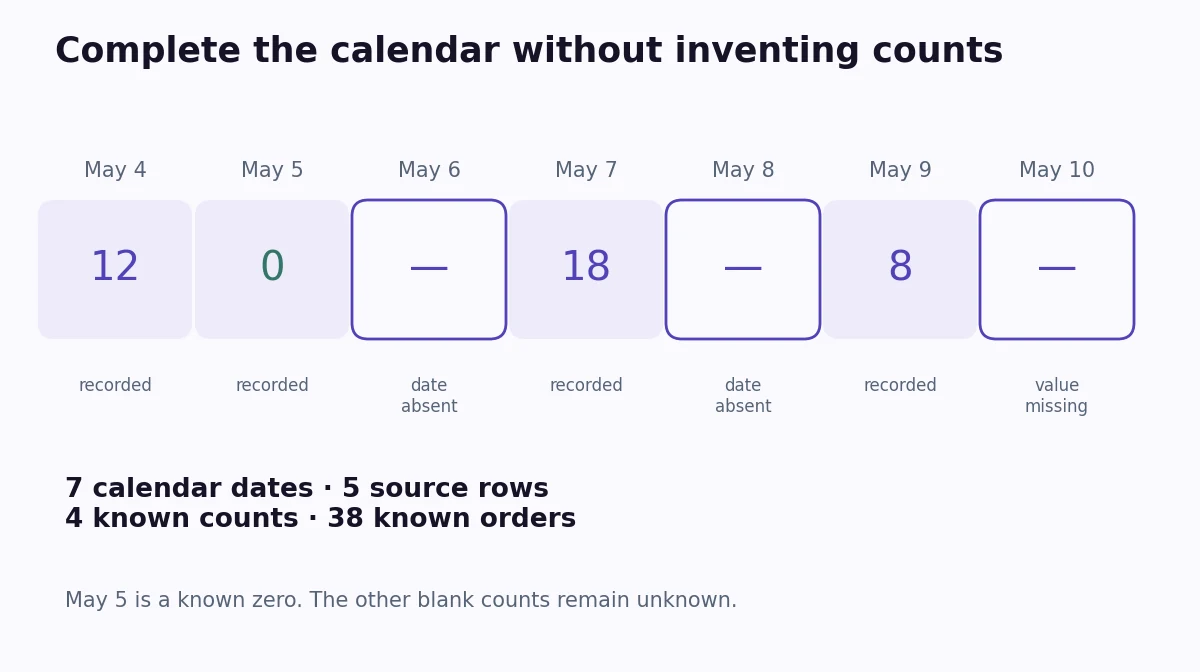
Start with five source rows
May 6 and May 8 are absent from this seven-day report. May 5 has a recorded zero, while May 10 exists as a row but has no order count. Those are three different data situations.
| date | orders |
|---|---|
| 2026-05-04 | 12 |
| 2026-05-05 | 0 |
| 2026-05-07 | 18 |
| 2026-05-09 | 8 |
| 2026-05-10 | Missing |
Run the following setup in a Python environment with pandas installed. The examples were executed with Python 3.11.3 and pandas 2.3.3; the current pandas API documentation was also reviewed.
import pandas as pd

source = pd.DataFrame({
    "date": ["2026-05-04", "2026-05-05", "2026-05-07",
             "2026-05-09", "2026-05-10"],
    "orders": pd.array([12, 0, 18, 8, None], dtype="Int64"),
})
The nullable Int64 type keeps whole order counts and a missing-value marker in the same column. The capital I matters: this is pandas’ nullable integer type.
Parse and validate the dates before adding rows
Our source is already a daily summary with one row per date and no times or time zones. The function uses an explicit YYYY-MM-DD format, rejects blank or invalid dates, and stops when dates repeat. It also checks that no source date would disappear outside the requested window.
Do not solve repeated dates by arbitrarily keeping the first row. If rows represent individual orders, summarize them into the intended daily measure first. If they are competing daily reports, resolve the conflict in the source.
Create the daily index and reindex the table
date_range defines the expected dates; reindex aligns the source to them. Here the window is explicitly May 4 through May 10, including both endpoints.
The source_row flag is created before reindexing. It lets us tell an introduced calendar row from an existing source row with a missing count.
def complete_daily_dates(source, start, end):
    daily = source.copy()
    daily["date"] = pd.to_datetime(
        daily["date"], format="%Y-%m-%d", errors="raise"
    )
    if daily["date"].isna().any():
        raise ValueError("Every source row needs a date.")
    if daily["date"].duplicated().any():
        raise ValueError("Resolve repeated dates before reindexing.")

    calendar = pd.date_range(start, end, freq="D", name="date")
    if calendar.empty:
        raise ValueError("The reporting window must contain a date.")
    if not daily["date"].isin(calendar).all():
        raise ValueError("A source date is outside the reporting window.")

    daily["source_row"] = pd.Series(True, index=daily.index, dtype="boolean")
    daily = daily.set_index("date").sort_index().reindex(calendar)
    daily["source_row"] = daily["source_row"].fillna(False)

    daily["status"] = "recorded"
    daily.loc[~daily["source_row"], "status"] = "date absent"
    daily.loc[daily["source_row"] & daily["orders"].isna(),
              "status"] = "value missing"
    return daily

daily = complete_daily_dates(source, "2026-05-04", "2026-05-10")
print(daily[["orders", "status"]].to_string())
The result is:
orders         status
date
2026-05-04      12       recorded
2026-05-05       0       recorded
2026-05-06    <NA>    date absent
2026-05-07      18       recorded
2026-05-08    <NA>    date absent
2026-05-09       8       recorded
2026-05-10    <NA>  value missing
The new May 6 and May 8 rows are marked date absent. The existing May 10 row is marked value missing. May 5 remains a recorded zero. No order counts have been invented.
Check completeness as well as totals
A sum of known values can be useful, but it is not automatically a complete-period total. Check the number of calendar dates, source rows, and known counts together:
print("Calendar dates:", len(daily))
print("Source rows:", int(daily["source_row"].sum()))
print("Known order counts:", int(daily["orders"].count()))
print("Known orders:", int(daily["orders"].sum(min_count=1)))
print("Complete-period total:", daily["orders"].sum(min_count=len(daily)))
Calendar dates: 7
Source rows: 5
Known order counts: 4
Known orders: 38
Complete-period total: <NA>The four known counts add to 38. Requiring seven known values with min_count=len(daily) leaves the complete-period total missing, since three daily counts are still unknown. This is an explicit completeness check for this one-row-per-day table, not a rule for every possible report.
Fill only the dates you can justify
Suppose a separate closure record now confirms that May 6 had no orders. Set that date to zero and retain a status explaining why. Leave May 8 and the blank count on May 10 alone.
closed = pd.to_datetime(["2026-05-06"])
if not closed.isin(daily.index).all():
    raise ValueError("A closed date is outside this report.")
if daily.loc[closed, "source_row"].any():
    raise ValueError("Review the existing source row before replacing it.")

daily.loc[closed, "orders"] = 0
daily.loc[closed, "status"] = "confirmed closed"
print(daily.loc["2026-05-06":"2026-05-10", ["orders", "status"]])
The known-order total is still 38, but we now know five daily counts rather than four. The seven-day total remains incomplete. Keep source_row unchanged: it records where a row came from, while status records what is currently known about its value.
Using reindex(..., fill_value=0) would assign zero to newly introduced locations. It would not replace an already-missing value in an existing row. Using fillna(0) on the count column would replace both kinds of missing value. Neither shortcut decides whether zero is factually correct.
Choose the reporting window deliberately
Using the first and last observed dates as automatic boundaries can hide missing days at the beginning or end of a report. Use the period the report is supposed to cover. The function rejects out-of-window records so they cannot silently vanish during reindexing.
This example uses every calendar day. A business-day index is a different reporting definition; a Monday-to-Friday frequency does not by itself encode a company’s holidays or unusual closures.
If the input contains timestamps, first decide the reporting time zone and how events map to local dates. Reducing times to dates may create repeated dates that need aggregation. Do that preparation before using this daily-summary workflow.
For a value that is missing inside an existing row, continue with the missing-values tutorial. If the input is spread across exports, combine the CSV files while preserving their original values, then validate the resulting daily summary.
Further reading
- pandas documentationDataFrame.reindexAlign rows to a stated index and understand introduced missing locations.
- pandas documentationpandas.date_rangeBuild the expected date index with a chosen frequency and boundaries.
- pandas documentationpandas.to_datetimeParse dates with an explicit format and error policy.
- pandas documentationSeries.sumUse min_count when a total should require enough known observations.