Calculate the estimated standard error of the mean from a list of numerical observations. The tool also reports the mean, count, and sample standard deviation, so you can see which values enter the calculation.
This calculator uses the sample standard deviation with an n − 1 divisor and then computes SEM = s / √n. Enter at least two observations. It does not calculate a confidence interval.
Calculate standard error of the mean
Maximum 10,000 observations and 200,000 characters, with up to 100 coefficient digits per value and input exponents from −100 to 100. No observations are silently discarded. Calculations run in your browser; input is not sent to a MathBlog calculation service.
Worked example
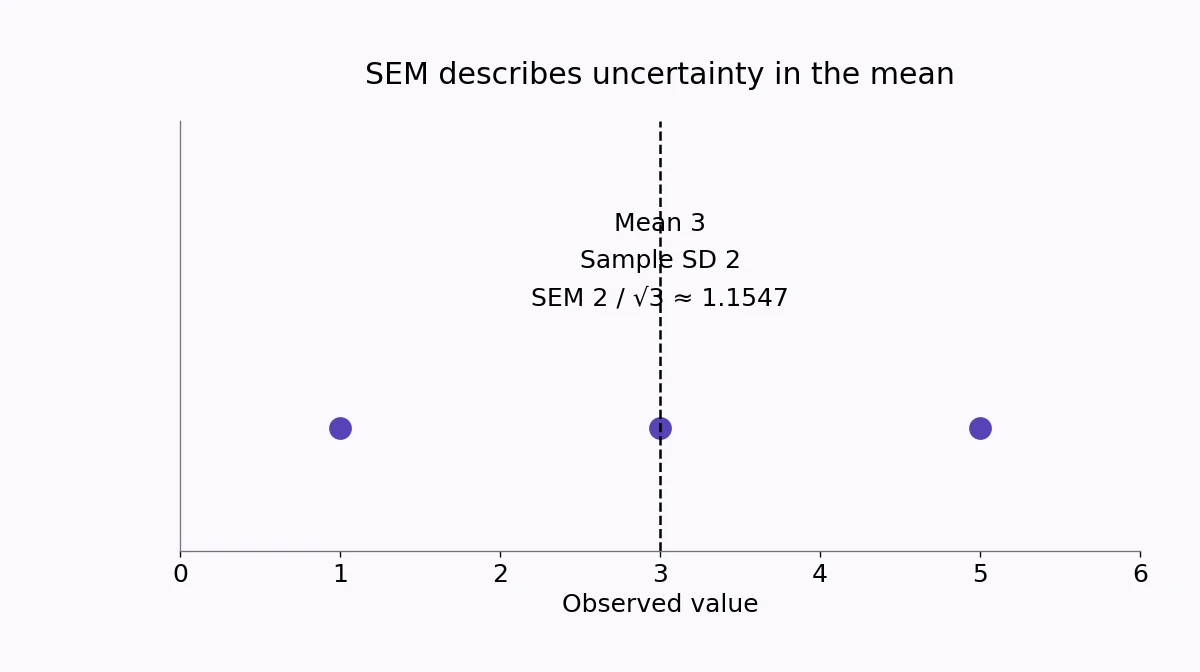
Enter 1 3 5. The mean is 3, and the squared deviations are 4, 0, and 4. Their sum is 8. Divide by 3 − 1 = 2 to get sample variance 4 and sample standard deviation 2.
The standard error is 2 / √3 ≈ 1.154700538. It is smaller than the sample SD because the two numbers summarize different things. SD describes individual observations; SEM estimates uncertainty in their mean under the model.
What the calculator assumes
The usual s/√n estimate applies to independent, identically distributed observations with finite variance. It is not automatically appropriate for clustered samples, repeated measurements, correlated time series, complex surveys, or unequal weights.
Entering duplicated rows as if they were new independent measurements can make the reported SEM misleadingly small. Check what each observation represents before interpreting the result.
Precision and data entry
Use a decimal point. Scientific notation, such as 1.2e-3, is accepted within the stated limits. Do not include unit labels, NaN, Infinity, or empty comma-separated entries. The calculator stops on invalid input rather than silently filtering the list.
Entered finite decimals are retained exactly for arithmetic. Variance is calculated before display rounding, and the final square root uses the unrounded value. Choose 6, 10, or 15 significant digits for displayed summaries.
The calculation explanation gives the exact fraction for SEM squared. A rounded SD shown on screen is not reused as an intermediate value. This avoids a second rounding step in the SEM result.
Interpreting zero or a small result
Identical input values produce sample SD zero and estimated SEM zero. That describes this sample; it does not establish that measurement uncertainty, selection bias, or all population variation is zero.
A small SEM does not mean that most individual observations lie close to the mean. It also does not make mean ± SEM a 95% interval. Confidence intervals require an appropriate multiplier and assumptions about sampling and the population.