Calculate Q1, the median, Q3, the interquartile range, and the 1.5 × IQR fences from numerical observations. Choose the quartile method explicitly so another reader can reproduce the results.
The default is linear interpolation using R type 7. A second option uses medians of the lower and upper halves, excluding the overall middle observation when the count is odd. This tool requires at least two observations.
Calculate quartiles and IQR
Maximum 10,000 observations and 200,000 characters, with up to 100 coefficient digits per value and input exponents from −100 to 100. No observations are silently discarded. Calculations run in your browser; input is not sent to a MathBlog calculation service.
Worked example
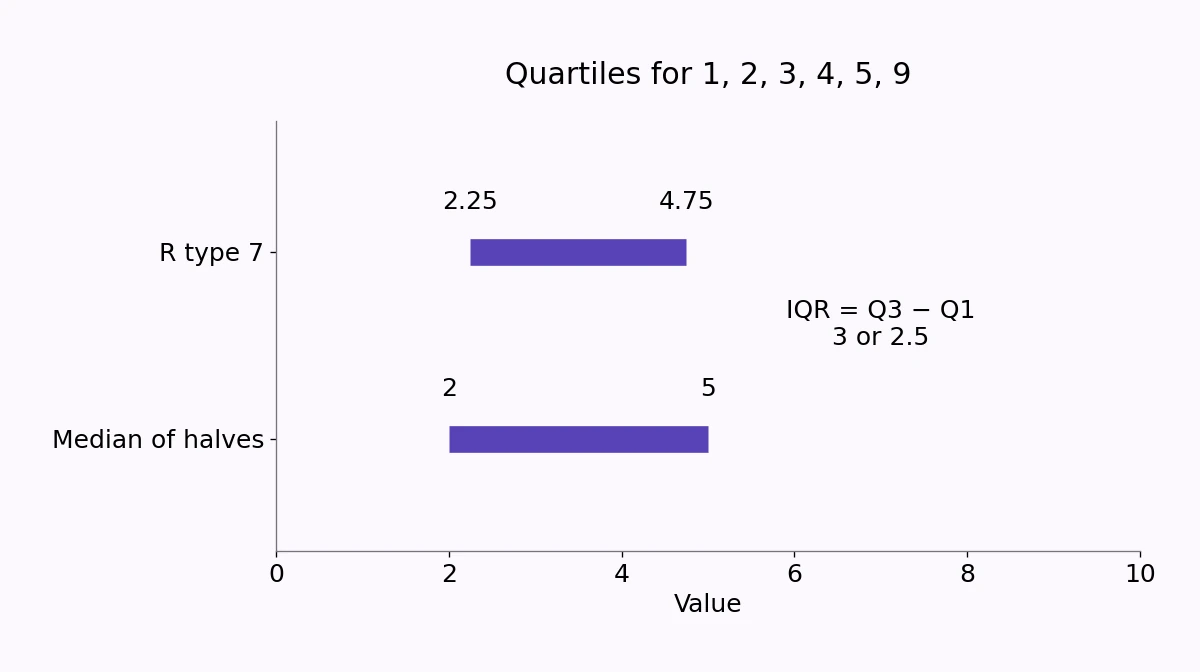
For 1 2 3 4 5 9, the default method gives Q1 = 2.25, median = 3.5, and Q3 = 4.75. Subtracting the quartiles gives IQR = 2.5.
The lower fence is 2.25 − 1.5 × 2.5 = −1.5. The upper fence is 4.75 + 1.5 × 2.5 = 8.5. The observation 9 lies above the upper fence, so it is flagged for investigation.
Switching the method
With median-of-halves, the same list gives Q1 = 2, Q3 = 5, and IQR = 3. Its upper fence is 9.5, so 9 is not flagged. This difference is a consequence of the declared algorithm, not a change in the observations.
For type 7, the one-based position for a percentile p is h = 1 + (n − 1)p. A fractional position interpolates between adjacent sorted values. Use p = 0.25 for Q1 and p = 0.75 for Q3.
For median-of-halves, sort first, split into equally sized halves, and find the median within each half. With an odd count, leave out the single overall middle observation before making the halves.
Read the flags carefully
Fences are Q1 − 1.5 × IQR and Q3 + 1.5 × IQR. Only values strictly outside them are flagged; values on a fence are retained without a flag. Repeated flagged observations are counted individually.
The tool lists at most 20 flagged observations in the explanation and states when the list is shortened. Calculations and the flag count always use the complete input. Display rounding does not determine which values cross a fence: comparisons use the exact values.
Do not delete observations solely because a fence labels them. A real unusual value may be central to your question. Check the source record, units, and suitability of the analysis before changing data.
When IQR is zero
If Q1 and Q3 coincide, IQR is zero and both fences coincide as well. Other observations may still differ and be flagged. Report that result honestly; zero IQR is not proof that the full range or standard deviation is zero.