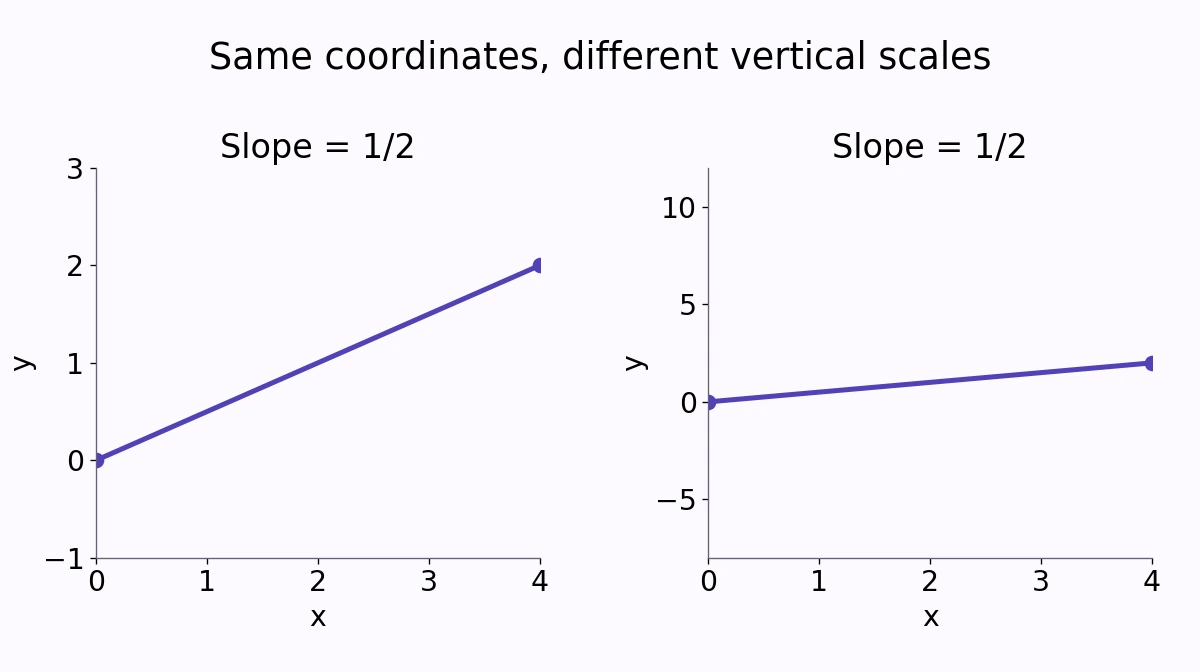
A line rising from \((0,0)\) to \((4,2)\) has slope \(\frac{1}{2}\). Draw it on two charts with different vertical scales and it can look almost flat on one and sharply inclined on the other. The numerical relationship has not changed.
A chart’s visual angle depends on how data units are mapped onto the screen. Reading the axes is part of reading the result, not a technical detail to postpone.
Slope counts units, not pixels
The vertical change in this example is 2, and the horizontal change is 4. Their ratio is \(\frac{2}{4}=0.5\). If x is measured in hours and y in miles, the slope is 0.5 mile per hour.
Stretching the vertical direction changes the number of pixels used for a y-unit. It does not change the original points or their rise divided by run. A picture alone cannot supply the units of a rate.
When both axes use equally sized units of the same kind, a line’s inclination is connected to the arctangent of its slope. When scales or units differ, the apparent angle is no longer a direct numerical reading of that slope.
Compare charts on the same scale
Suppose two departments show the same increase from 100 to 110 over a year. One graph uses a vertical axis from 0 to 200; the other uses 99 to 111. The second line occupies far more vertical space even though the increase is still 10.
A shortened vertical range can reveal small variations that a broad range hides. That can be useful. It also makes side-by-side visual comparisons unreliable unless the ranges, units, and time intervals are checked.
Do not apply one axis rule to every chart. Bars encode magnitude through length, so their baseline has a particularly direct effect on interpretation. A line chart can use a focused range, provided the labels make that choice clear and the story matches the numbers.
Changing units changes the numerical slope
Now express the original two-mile rise in feet while keeping the same four-hour run. The slope becomes \(\frac{10{,}560}{4}=2{,}640\) feet per hour. That is the same physical rate as 0.5 mile per hour, written in different units.
Resizing a graph and converting a variable are therefore different operations. The first changes the display. The second changes the numerical coordinates and units, so the numerical slope changes as well.
Read a line with three checks
Identify each variable and unit, inspect the axis limits, then calculate a rise over a stated run. For a curved graph, a secant slope describes an interval; it is not automatically the instantaneous rate at every point.
MathBlog’s slope guide explains the underlying ratio. Use that ratio to evaluate a claim before deciding what the visual steepness suggests.