A 99% confidence interval conveys a 99% probability that the actual population parameter falls within the specified range. This level represents one of the highest standards of confidence used in statistical analysis, providing an exceptional degree of assurance in the precision of the findings. Selecting a 99% confidence level demonstrates a profound commitment to accuracy, reflecting a preference for exhaustive thoroughness in data analysis. While it requires a substantially larger sample size compared to lower confidence intervals, the trade-off is a markedly high level of confidence in the representativeness of the results.
The Z-score for a 99% interval is approximately 2.58.
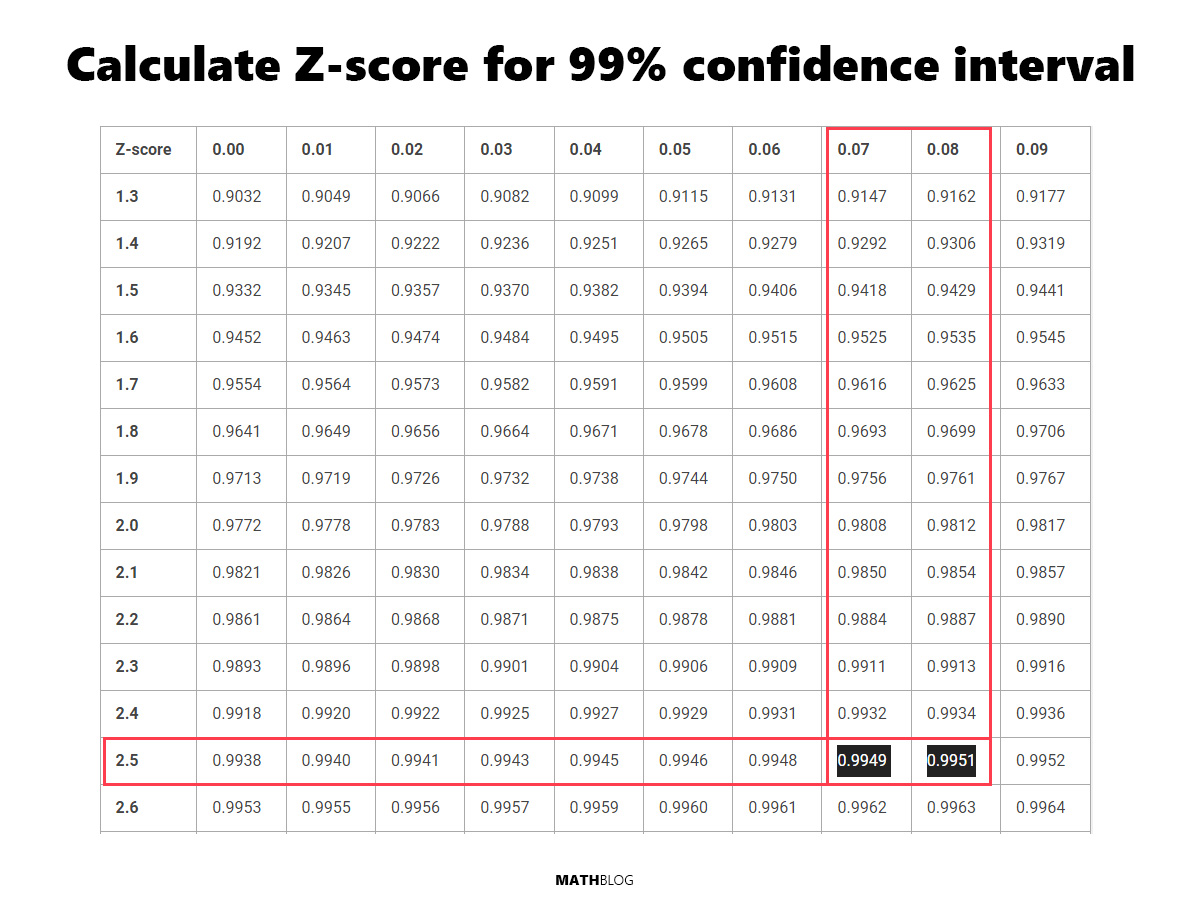
How to calculate the Z-score for 99% confidence interval
A Z-table provides the area (probability) to the left of a Z-score in a standard normal distribution. Here’s how to use it for a 99% confidence interval:
- Determine Tail Areas: Since a 99% confidence interval means 99% of the data is within the interval, there’s 0.5% of the data in each tail of the distribution (100% – 99% = 1%, divided by 2 because there are two tails).
- Calculate Cumulative Area: For a 99% confidence interval, we want the area to the left of the Z-score to include half of the tail area, plus the confidence interval itself. This equals 0.995 (99% confidence + 0.5% tail).
- Find the Z-score in the Z-table: Look up the area closest to 0.995 in the Z-table. The Z-score that corresponds to this area is approximately 2.58. This is the value that indicates our data point is 2.58 standard deviations from the mean.
Below is a Z-table and how it was used to identify the Z-score for a 99% confidence interval.
How Precise Should Your Z-score Be?
If you need a quick estimate that is easy to calculate and understand, using an approximation like 2.05 is perfectly acceptable. It’s especially useful in educational settings or initial analyses where the exact precision isn’t critical. Whether to use an approximation or the exact Z-score for a confidence interval calculation depends on the context and precision requirements of your analysis.
You can use an arithmetic method to estimate the Z-score between two values in a Z-table if the exact value for your desired confidence level isn’t listed. This approach, often called linear interpolation, can give you a closer approximation of the Z-score than simply selecting the closest value.
Calculating the Z-score using linear interpolation
Given that the Z-table does not list the exact cumulative area for a 99% confidence interval which is 0.995, but has 0.9949 (Z = 2.57) and 0.9951 (Z = 2.58), we can interpolate to estimate the Z-score.
- Identify Lower and Upper Bounds:
- Lower bound Z-score (Z1) = 2.57 with a cumulative area of 0.9949.
- Upper bound Z-score (Z2) = 2.58 with a cumulative area of 0.9951.
- Determine the Cumulative Area You Need (A):
- A = 0.98 (the target cumulative area for a 99% CI).
- Calculate the Difference in Area and Z-scores:
- Difference in cumulative area (ΔA) = 0.9951 – 0.9949 = 0.002.
- Difference in Z-scores (ΔZ) = 2.58 – 2.57= 0.01.
- Calculate the Proportion of Your Area Within the Interval:
- Proportion (P) = (A – 0.9949) / ΔA = (0.9950 – 0.9949) / 0.0002 = 0.5
- Estimate the Z-score:
- Estimated Z = Z1 + (P * ΔZ) = 2.57 + 0.5 * 0.01 = 2.575
For most general purposes, educational contexts, and preliminary analyses, using an approximation like 2.58 for a 99% confidence interval is entirely adequate. However, for rigorous scientific research, publishing, or any situation where the accuracy of your results is paramount, taking the extra step to calculate the exact Z-score is the best approach.
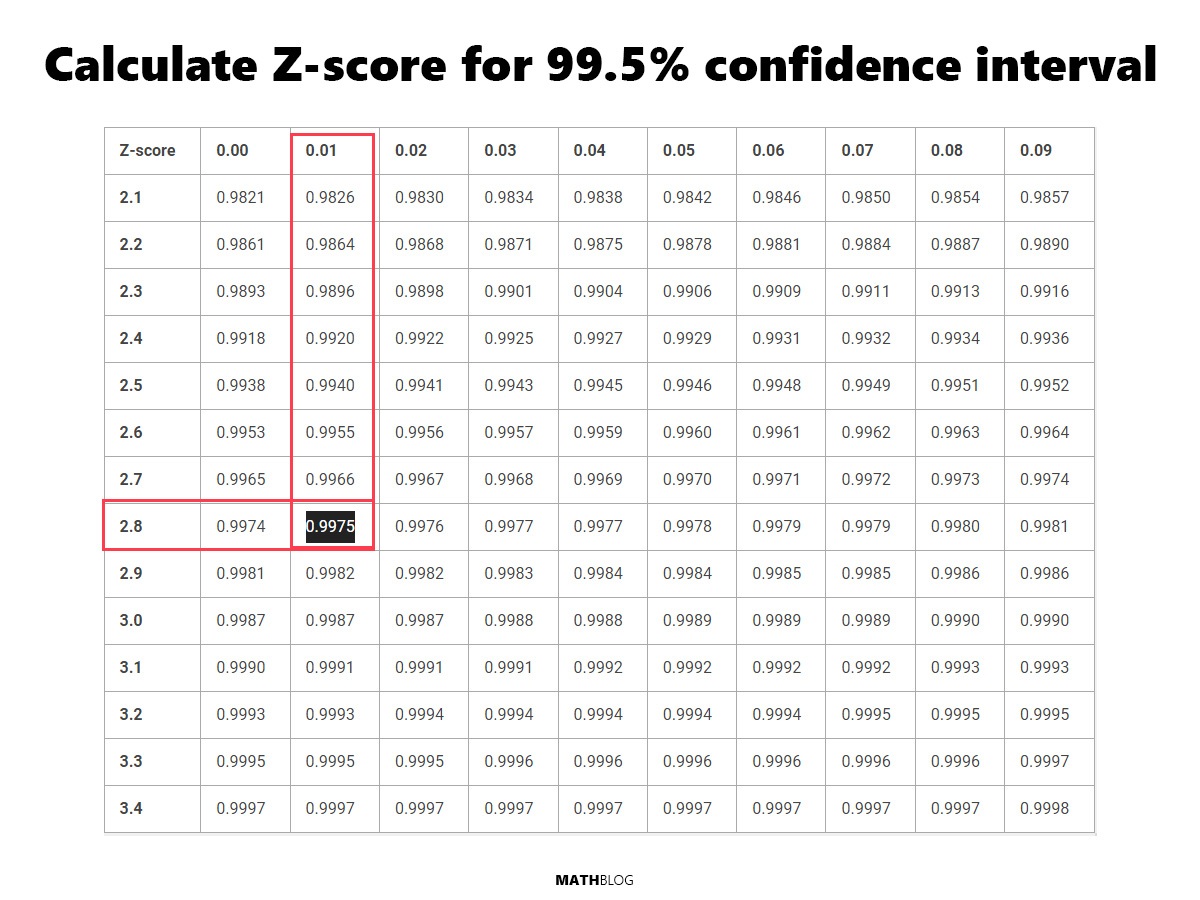
What is the Z-score for a 99.5% confidence interval
This exceptionally high level of confidence is seldom used in standard practice but offers near-absolute certainty in the results obtained from statistical analysis. Choosing a 99.5% confidence level underscores an unparalleled commitment to precision, ensuring that the interval is as accurate and representative of the population as possible. Although this level demands a significantly larger sample size than even a 99% confidence interval, the benefit is a profound assurance in the accuracy of the findings, suitable for research where the margin for error must be minimized to the utmost extent.
The Z-score for a 99.5% interval is approximately 2.81.
Find the (1 + 0.995) / 2 = 0.9975 value in the table below to find the Z-score for a 99.5% CI.
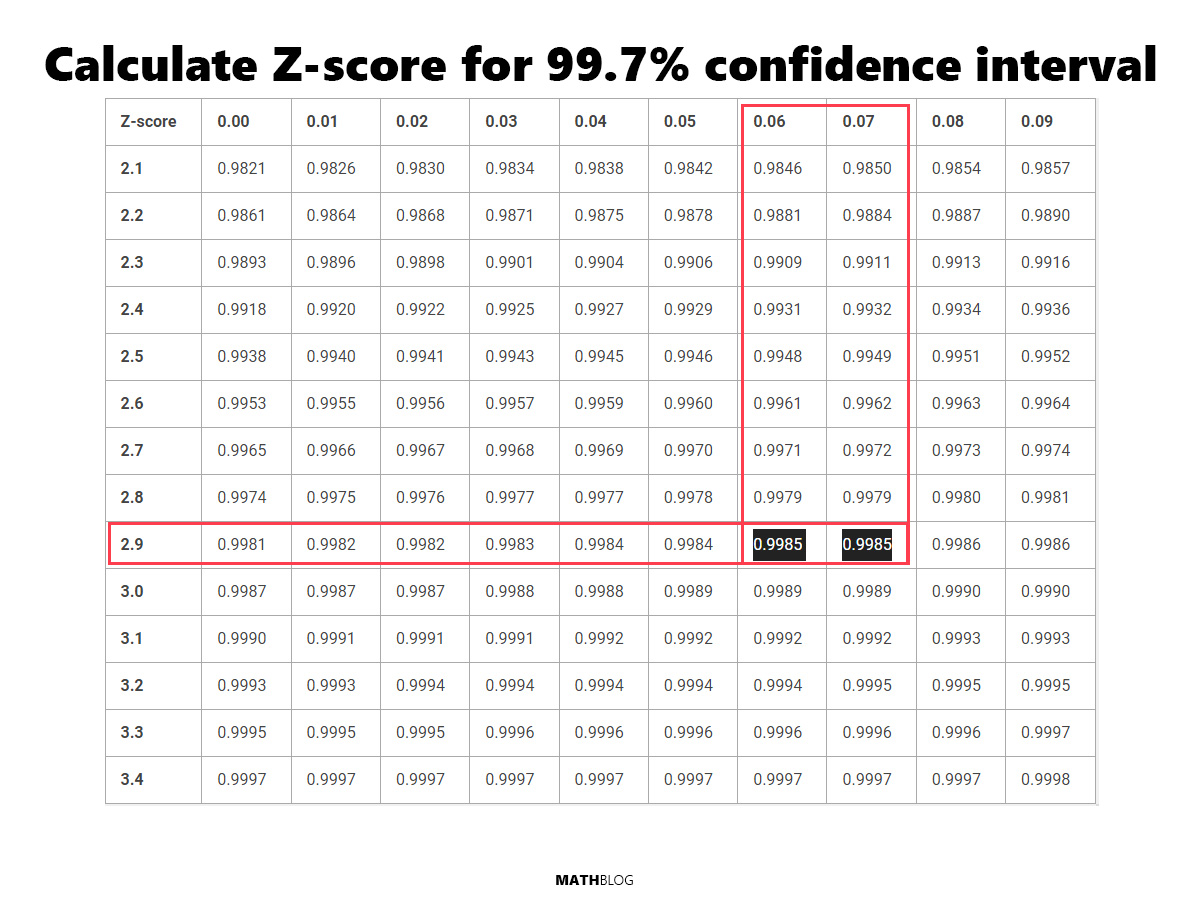
What is the Z-score for a 99.7% confidence interval
This level of confidence is exceptionally high, almost guaranteeing the accuracy of the interval in representing the true population parameter.
The Z-score for a 99.7% interval is approximately 2.965.
Find the (1 + 0.995) / 2 = 0.9985 value in the table below to find the Z-score for a 99.7% CI.
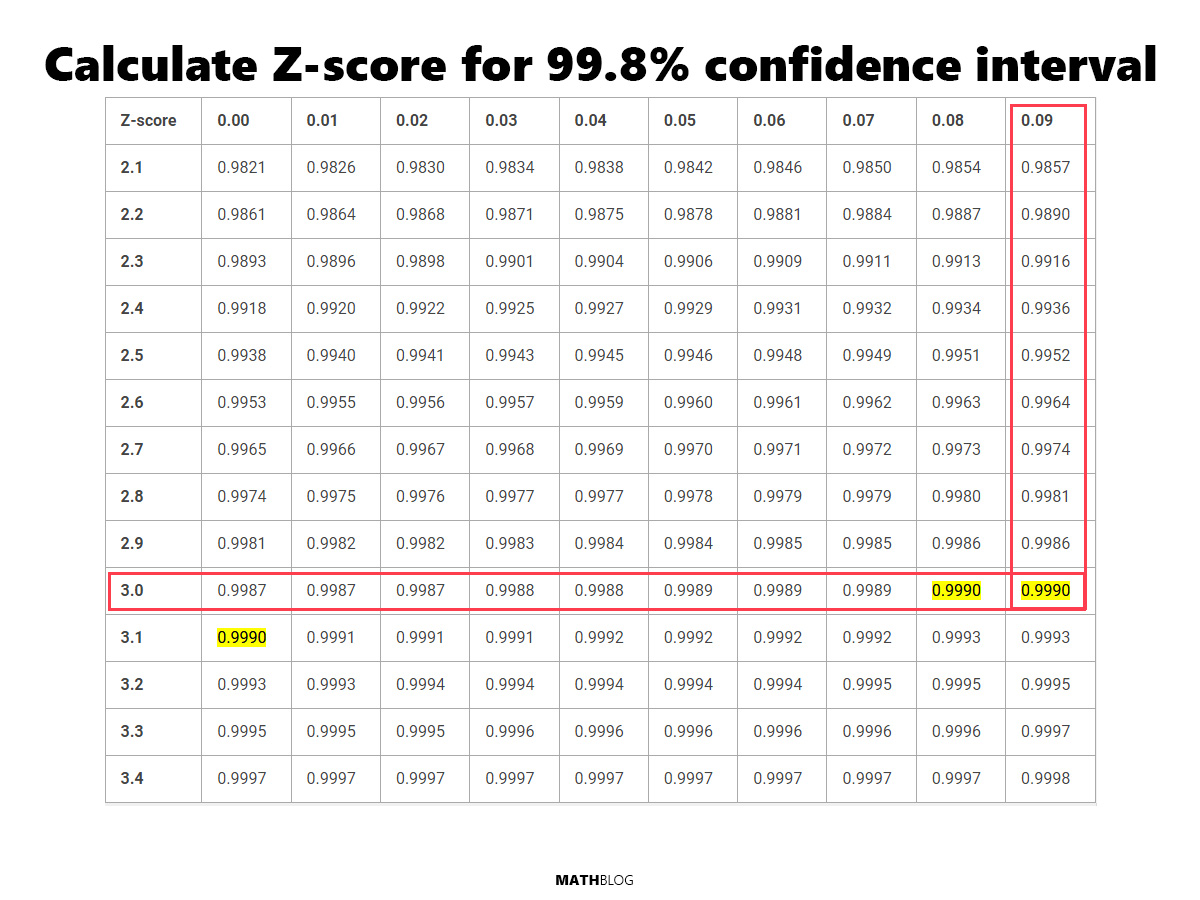
What is the Z-score for a 99.8% confidence interval
This extraordinarily high level of confidence is rarely employed in everyday statistical analysis but is reserved for scenarios where the implications of uncertainty are especially critical.
The Z-score for a 99.8% interval is approximately 3.09
Find the (1 + 0.998) / 2 = 0.999 value in the table below to find the Z-score for a 99.8% CI.
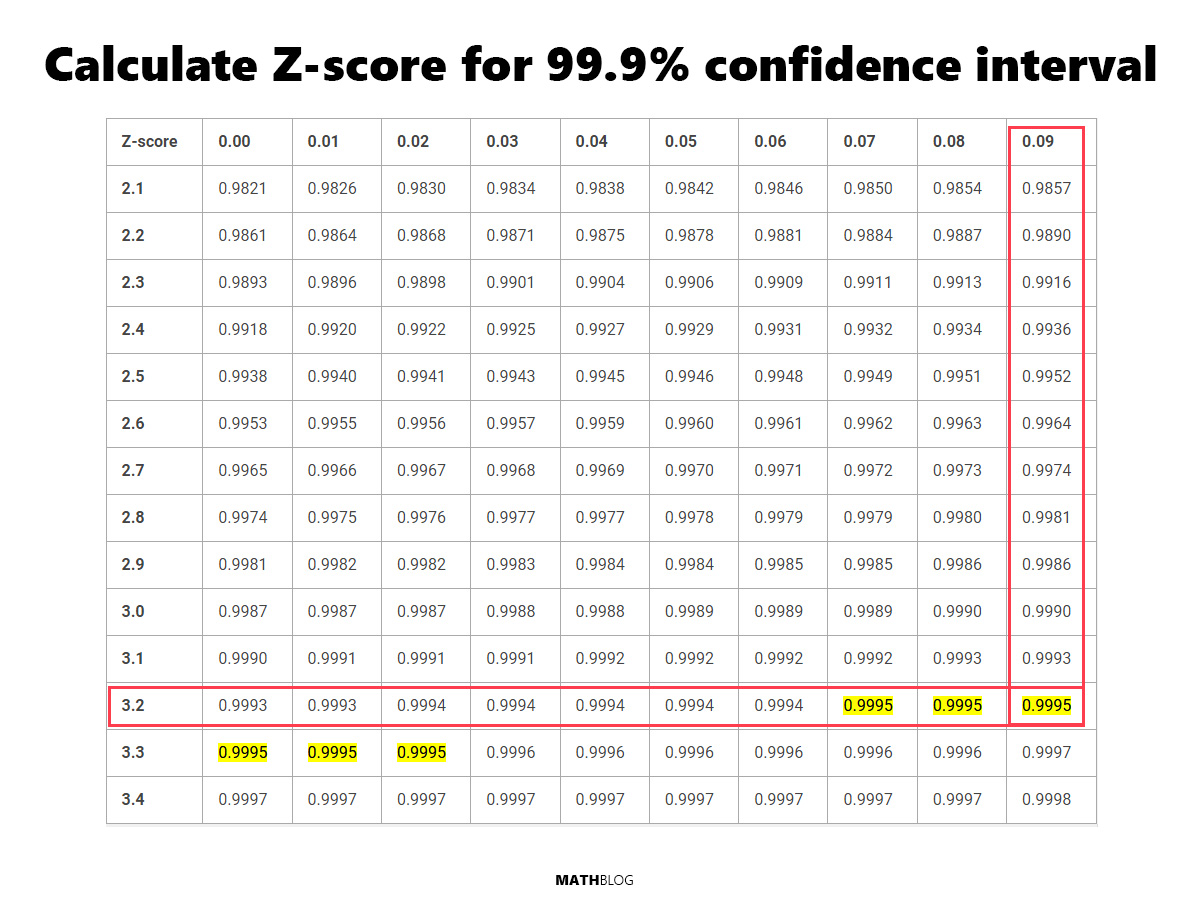
What is the Z-score for a 99.9% confidence interval
This level of confidence is among the highest utilized in statistical analysis, reflecting an extreme level of assurance in the interval’s accuracy.
The Z-score for a 99.9% interval is approximately 3.29.
Find the (1 + 0.999) / 2 = 0.9995 value in the table below to find the Z-score for a 99.9% CI.