Confidence intervals offer a statistical range that is likely to contain the true population parameter, illuminating the precision and reliability of these estimates. Central to their construction for large sample sizes is the Z-score, which measures how many standard deviations an observation deviates from the mean, especially critical when the population standard deviation is known.
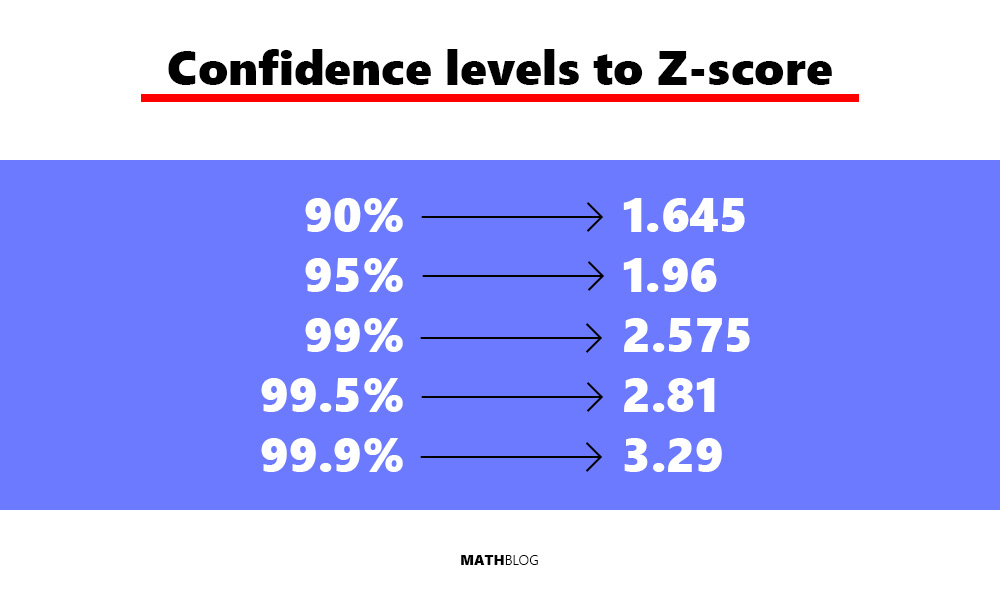
This relationship between Z-scores and confidence intervals enables researchers to assess the accuracy of their estimates. The selection of confidence levels—from the commonly used 95% to others like 90% and 99%—directly influences the certainty with which the population parameter is estimated to lie within the interval, underscored by the Central Limit Theorem’s assurance of a normally distributed sample mean for large samples.
Estimation involves two types: point estimates and interval estimates (confidence intervals). A point estimate provides a single value as the best guess for a population parameter, such as a population mean (μ) or proportion (p). Sample means (
The formula for confidence interval around a sample mean, when you know the population standard deviation (σ), is:
The formula for confidence interval illustrates how the margin of error expands or contracts based on the Z-score and the standard error of the sample mean.
Higher confidence levels require larger Z-scores, resulting in wider intervals. This reflects a trade-off between confidence and precision: higher confidence levels offer greater assurance that the interval contains the population parameter but at the cost of less precise estimates.
Z-Scores for Confidence Intervals (Table)
To calculate the Z-score for a known confidence interval you’ll need to read a Z-table, which shows the area under the normal curve to the left of a given Z-score. Since you’re dealing with tail areas (or the complement in the case of the area to the left), you need to calculate the cumulative area up to the Z-score that corresponds to your confidence level.
| Confidence Level (%) | Z-score |
|---|---|
| 80 | 1.28 |
| 85 | 1.44 |
| 86 | 1.475 |
| 90 | 1.645 |
| 91 | 1.695 |
| 92 | 1.751 |
| 93 | 1.812 |
| 94 | 1.881 |
| 95 | 1.96 |
| 96 | 2.05 |
| 97 | 2.17 |
| 98 | 2.326 |
| 99 | 2.575 |
| 99.9 | 3.291 |
Table 1 provides a concise reference for quickly finding the Z-score associated with a range of confidence levels. This is instrumental in statistical analysis, especially when constructing confidence intervals or conducting hypothesis testing. The table spans from an 80% confidence level up to a 99.9% confidence level, with corresponding Z-scores calculated based on the standard normal distribution.
Which confidence interval should I use?
Opting for an 80% confidence level in decision-making introduces a significant risk of error, with a one in five chance that projections based on such data could be completely off-target. This level of confidence might lead to incorrect conclusions or actions being taken more frequently than one might expect.
On the other hand, aiming for a 99% confidence level, while substantially reducing the risk of error, can be impractical. It often requires a much larger sample size or more data, which might not always be feasible or efficient in terms of time and resources.
The key is to find a balance that minimizes risk while also being realistic about the data and resources available, allowing for informed decisions without unnecessary delay.
How to calculate Z-score from CI, yourself?
To understand how the Z-scores in Table 1 were calculated, consider wanting to construct a 95% confidence interval for a population mean.
The process of finding a Z-score for a given confidence level involves:
- Determining the desired confidence level and its corresponding tail areas. For a 95% confidence level there’s 2.5% in each tail.
- Using a Z-table or standard normal distribution calculator, identify the Z-score that corresponds to the cumulative area up to the desired confidence level. For our 95% confidence level, that means finding the Z-score corresponding to the cumulative area of 0.975.
Quick Note: The value you need to search in the Z-table is calculated as (1+CI)/2.
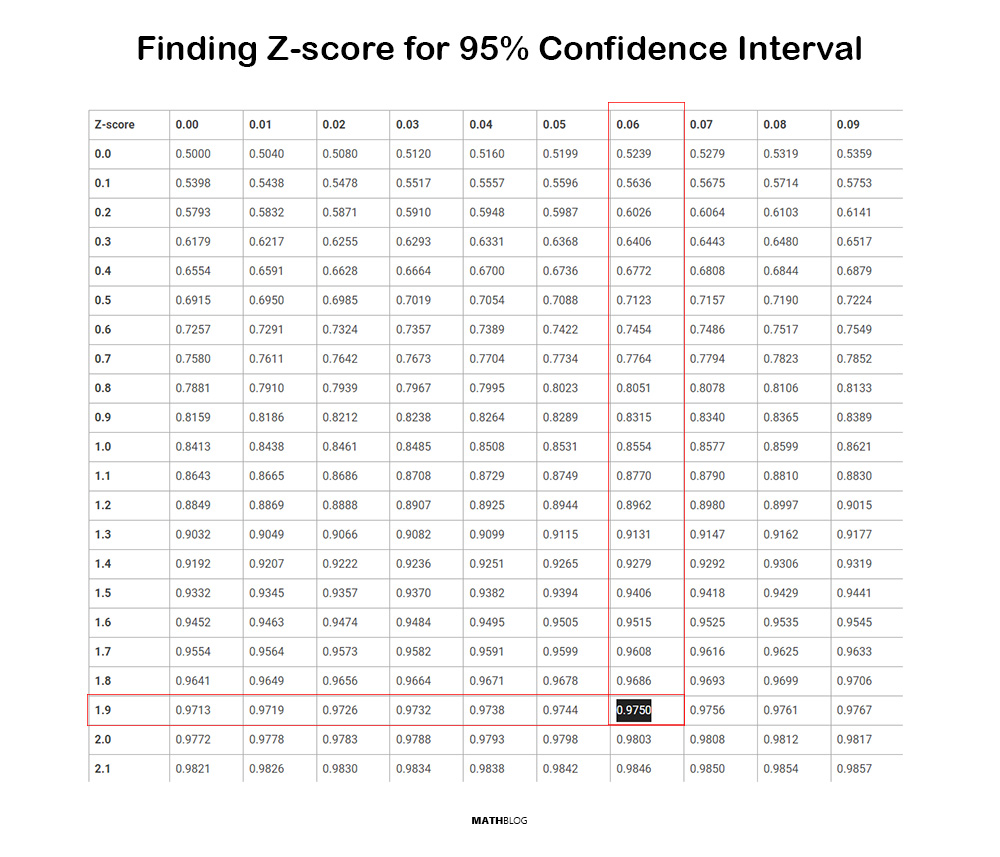
The Z-score for a 95% confidence level is found to be 1.96. This means that for a standard normal distribution, approximately 95% of the distribution lies within ±1.96 standard deviations from the mean. This Z-score is used to calculate the margin of error in a confidence interval formula, thus defining the range likely to contain the population parameter.
By referencing Table 1, users can bypass the calculation or lookup process for these common confidence levels, streamlining the construction of confidence intervals and the application of hypothesis testing.