An 80% confidence interval means there is an 80% chance that the true population parameter falls within our calculated range. It offers less confidence than higher levels like 95% but requires a smaller sample size, making it quicker and less resource-intensive.
The Z-score for an 80% confidence interval is approximately 1.28.
How to calculate the Z-score for 80% confidence interval
A Z-table provides the area (probability) to the left of a Z-score in a standard normal distribution. Here’s how to use it for an 80% confidence interval:
- Determine Tail Areas: Since an 80% confidence interval means 80% of the data is within the interval, there’s 10% of the data in each tail of the distribution (100% – 80% = 20%, divided by 2 because there are two tails).
- Calculate Cumulative Area: For an 80% confidence interval, we want the area to the left of the Z-score to include half of the tail area, plus the confidence interval itself. This equals 0.9 (80% confidence + 10% tail).
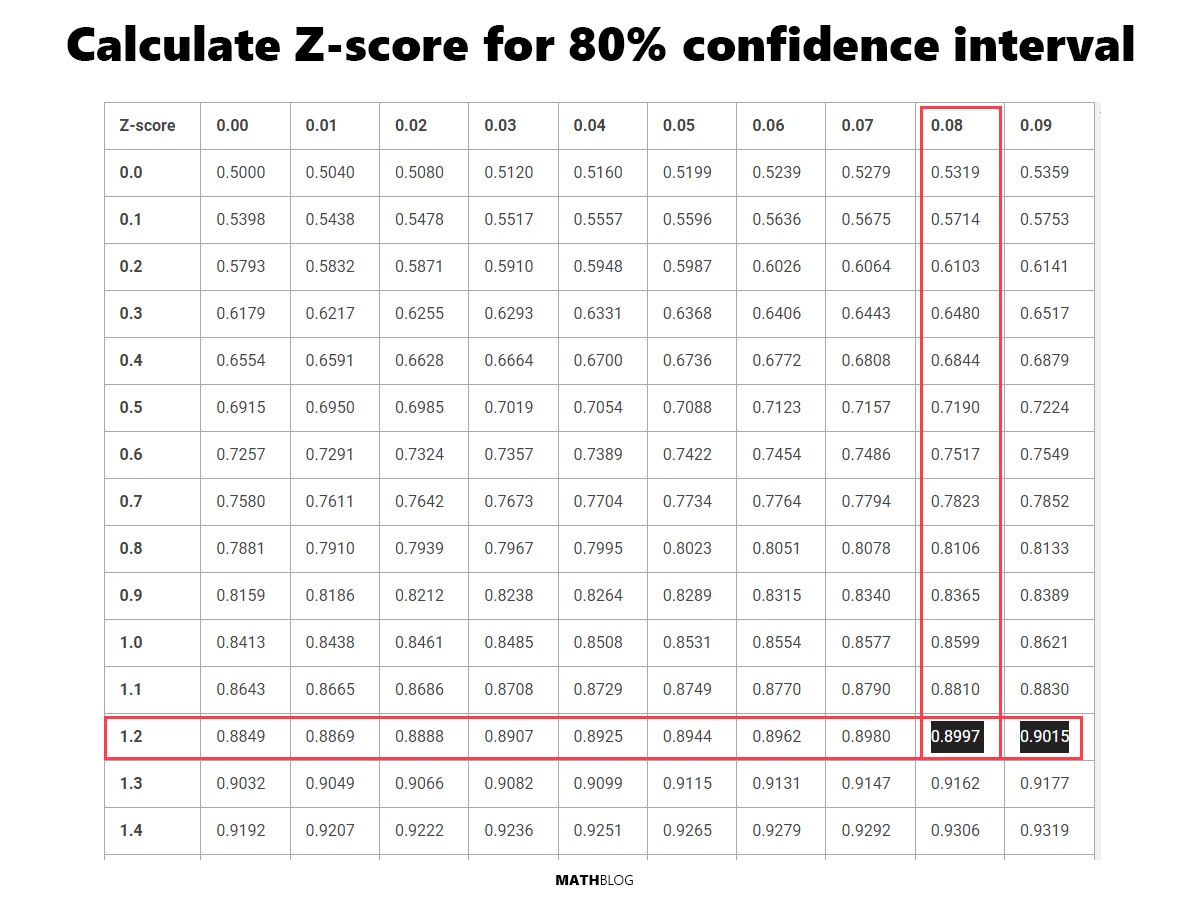
- Find the Z-score in the Z-table: Look up the area closest to 0.9 in the Z-table. The Z-score that corresponds to this area is approximately 1.28. This is the value that indicates our data point is 1.28 standard deviations from the mean.
Below is a Z-table and how it was used to identify the Z-score for an 80% confidence interval.
Should I just use an approximation?
If you need a quick estimate that is easy to calculate and understand, using an approximation like 1.28 is perfectly acceptable. It’s especially useful in educational settings or initial analyses where the exact precision isn’t critical. Whether to use an approximation or the exact Z-score for a confidence interval calculation depends on the context and precision requirements of your analysis.
You can use an arithmetic method to estimate the Z-score between two values in a Z-table if the exact value for your desired confidence level isn’t listed. This approach, often called linear interpolation, can give you a closer approximation of the Z-score than simply selecting the closest value.
Calculating the Z-score using linear interpolation
The Z-table doesn’t list 0.9 exactly but has values for 0.8997 (Z = 1.28) and 0.9015 (Z = 1.29). You can interpolate to estimate the Z-score for a cumulative area of 0.9.
- Identify Lower and Upper Bounds:
- Lower bound Z-score (Z1) = 1.28 with a cumulative area of 0.8997.
- Upper bound Z-score (Z2) = 1.29 with a cumulative area of 0.9015.
- Determine the Cumulative Area You Need (A):
- A = 0.9 (the target cumulative area for an 80% CI).
- Calculate the Difference in Area and Z-scores:
- Difference in cumulative area (ΔA) = 0.9015 – 0.8997 = 0.0018.
- Difference in Z-scores (ΔZ) = 1.29 – 1.28 = 0.01.
- Calculate the Proportion of Your Area Within the Interval:
- Proportion (P) = (A – 0.8997) / ΔA = (0.9 – 0.8997) / 0.0018 = 0.16666666666
- Estimate the Z-score:
- Estimated Z = Z1 + (P * ΔZ) = 1.28 + 0.16666666666 * 0.01 = 1.28166666667
For most general purposes, educational contexts, and preliminary analyses, using an approximation like 1.28 for an 80% confidence interval is entirely adequate. However, for rigorous scientific research, publishing, or any situation where the accuracy of your results is paramount, taking the extra step to calculate the exact Z-score is the best approach.