A 97% confidence interval provides a 97% probability that the actual population parameter is encompassed within our calculated range. Elevating the confidence level above a 96% interval, it delivers increased certainty, nearing the upper echelons of confidence typically used in statistical analysis. Choosing a 97% confidence level signifies a rigorous approach to accuracy, requiring a modestly larger sample size than slightly lower confidence levels but offering substantial assurance in the findings. This level is well-suited for research demanding high precision while still maintaining a balance with logistical considerations.
The Z-score for a 97% interval is roughly 2.17.
How to calculate the Z-score for 97% confidence interval
A Z-table provides the area (probability) to the left of a Z-score in a standard normal distribution. Here’s how to use it for a 97% confidence interval:
- Determine Tail Areas: Since a 97% confidence interval means 97% of the data is within the interval, there’s 1.5% of the data in each tail of the distribution (100% – 97% = 3%, divided by 2 because there are two tails).
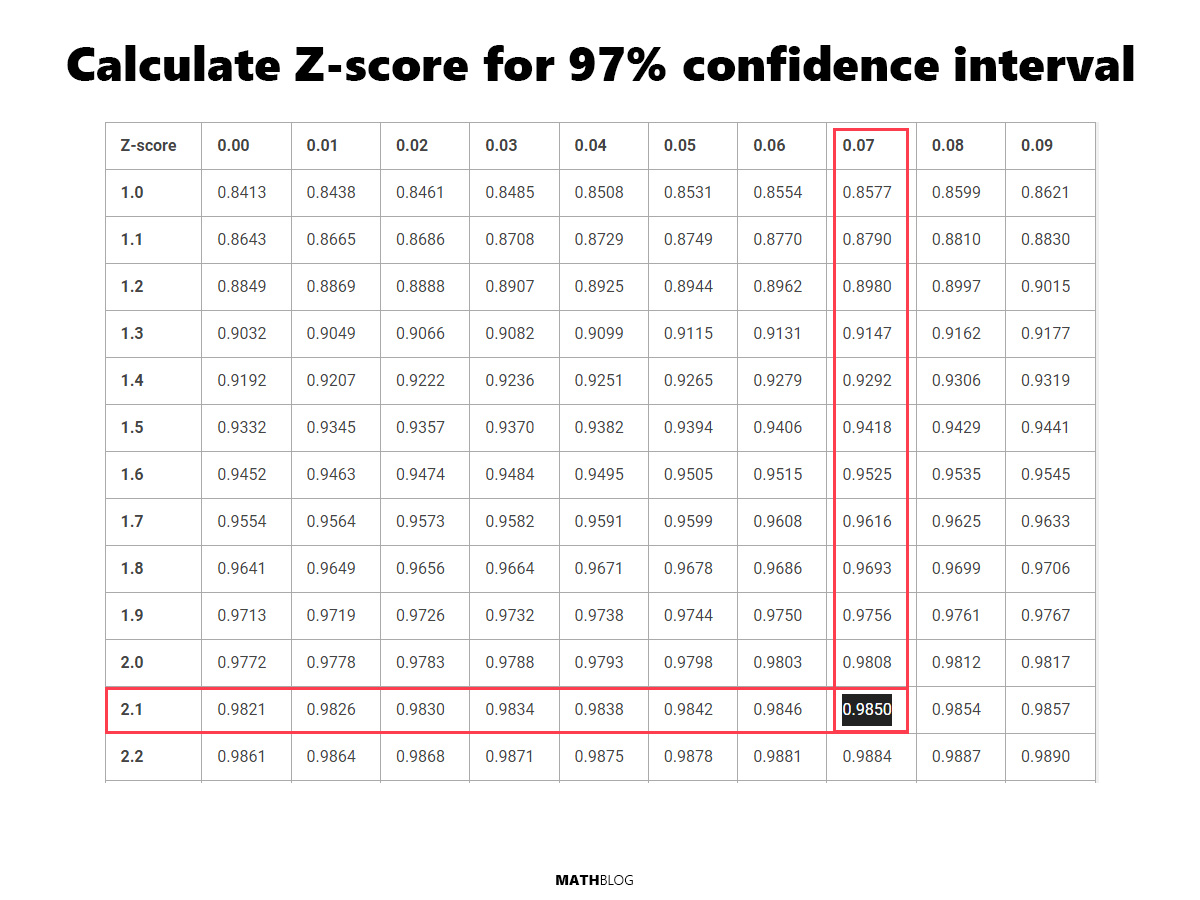
- Calculate Cumulative Area: For a 97% confidence interval, we want the area to the left of the Z-score to include half of the tail area, plus the confidence interval itself. This equals 0.985 (97% confidence + 1.5% tail).
- Find the Z-score in the Z-table: Look up the area closest to 0.985 in the Z-table. The Z-score that corresponds to this area is approximately 2.17. This is the value that indicates our data point is 2.17 standard deviations from the mean.
Below is a Z-table and how it was used to identify the Z-score for a 97% confidence interval.