A 95% confidence interval establishes a 95% probability that the actual population parameter lies within our computed range. This confidence level is among the most commonly used, offering a high degree of assurance while setting a standard for reliability in many research fields. Adopting a 95% confidence level reflects a commitment to robustness and accuracy in findings, necessitating a larger sample size than lower confidence intervals but justifying this with a strong level of confidence in the results obtained.
The Z-score for a 95% interval is approximately 1.96.
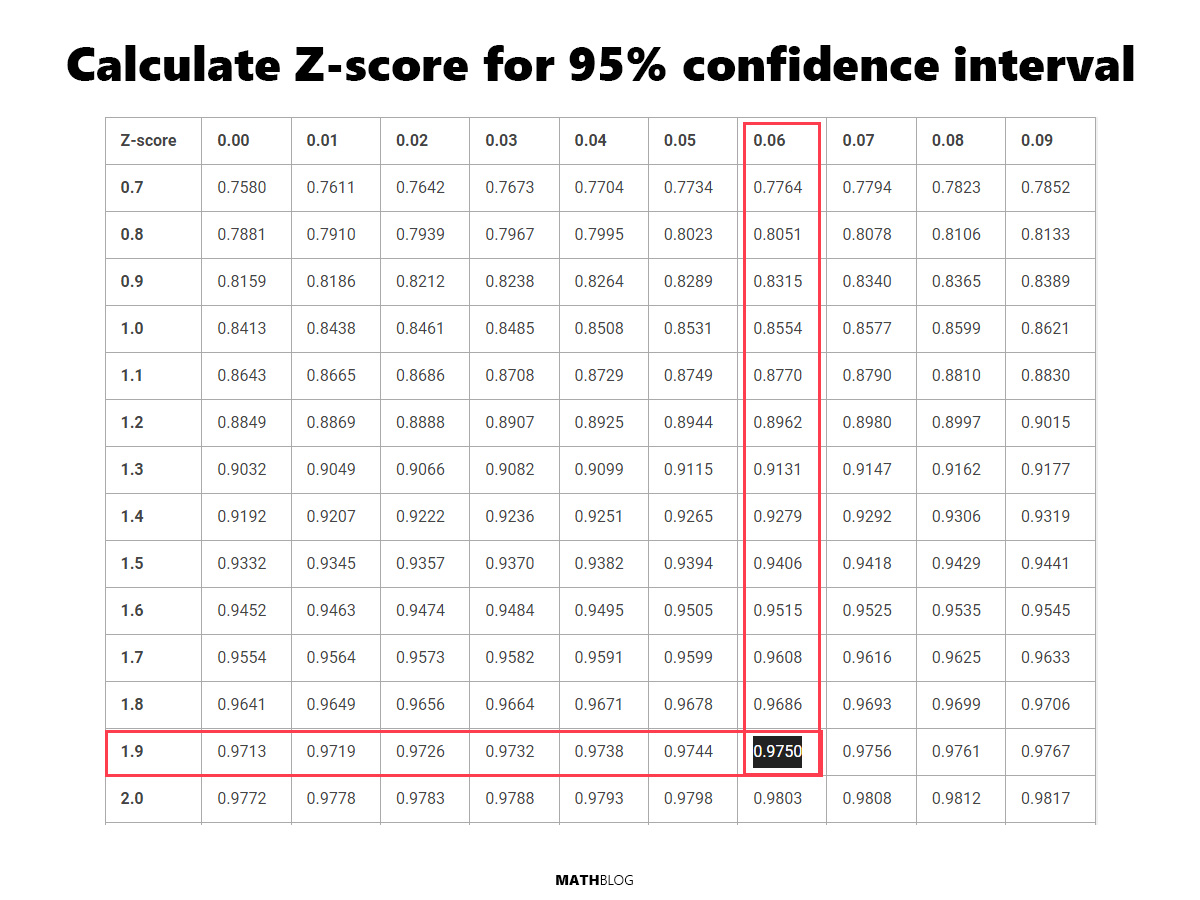
How to calculate the Z-score for 95% confidence interval
A Z-table provides the area (probability) to the left of a Z-score in a standard normal distribution. Here’s how to use it for a 95% confidence interval:
- Determine Tail Areas: Since a 95% confidence interval means 95% of the data is within the interval, there’s 2.5% of the data in each tail of the distribution (100% – 95% = 5%, divided by 2 because there are two tails).
- Calculate Cumulative Area: For a 95% confidence interval, we want the area to the left of the Z-score to include half of the tail area, plus the confidence interval itself. This equals 0.975 (95% confidence + 2.5% tail).
- Find the Z-score in the Z-table: Look up the area closest to 0.975 in the Z-table. The Z-score that corresponds to this area is approximately 1.96. This is the value that indicates our data point is 1.96 standard deviations from the mean.
Below is a Z-table and how it was used to identify the Z-score for a 95% confidence interval.