A 92% confidence interval indicates there’s a 92% probability that the actual population parameter resides within the specified range. This confidence level provides more certainty than a 90% confidence interval, yet it does not reach the assurance level of a 95% confidence interval. Opting for a 92% confidence level represents a nuanced approach, increasing confidence in the results with only a slight uptick in the necessary sample size. This choice is ideal for scenarios requiring a fine balance between high confidence and resource management, offering a substantial degree of accuracy without the full resource commitment needed for the highest confidence levels.
The Z-score for a 92% confidence interval is approximately 1.75.
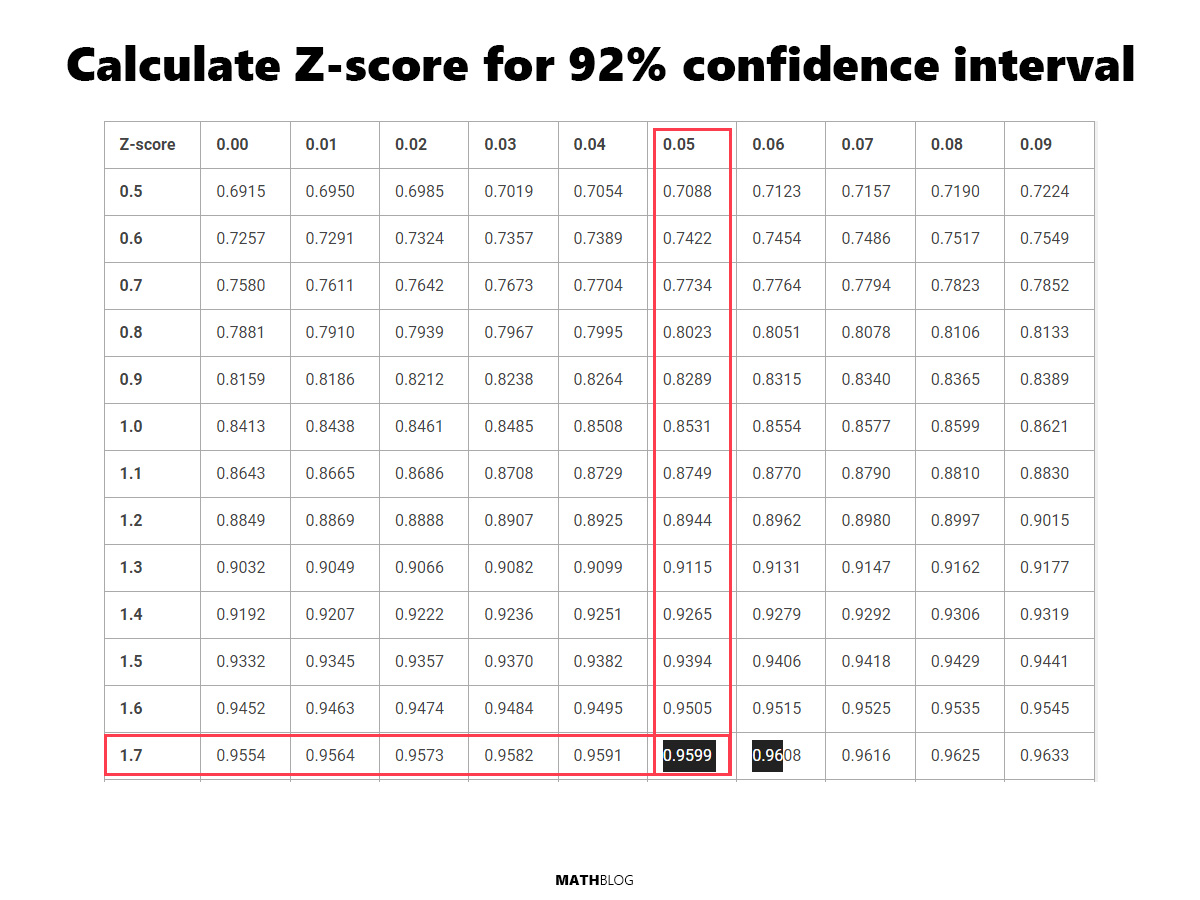
How to calculate the Z-score for 92% confidence interval
A Z-table provides the area (probability) to the left of a Z-score in a standard normal distribution. Here’s how to use it for a 92% confidence interval:
- Determine Tail Areas: Since a 92% confidence interval means 92% of the data is within the interval, there’s 4% of the data in each tail of the distribution (100% – 92% = 8%, divided by 2 because there are two tails).
- Calculate Cumulative Area: For a 92% confidence interval, we want the area to the left of the Z-score to include half of the tail area, plus the confidence interval itself. This equals 0.96 (92% confidence + 4% tail).
- Find the Z-score in the Z-table: Look up the area closest to 0.96 in the Z-table. The Z-score that corresponds to this area is approximately 1.75. This is the value that indicates our data point is 1.75 standard deviations from the mean.
Below is a Z-table and how it was used to identify the Z-score for a 92% confidence interval.
Can I calculate a more accurate Z-score?
If you need a quick estimate that is easy to calculate and understand, using an approximation like 1.75 is perfectly acceptable. It’s especially useful in educational settings or initial analyses where the exact precision isn’t critical. Whether to use an approximation or the exact Z-score for a confidence interval calculation depends on the context and precision requirements of your analysis.
You can use an arithmetic method to estimate the Z-score between two values in a Z-table if the exact value for your desired confidence level isn’t listed. This approach, often called linear interpolation, can give you a closer approximation of the Z-score than simply selecting the closest value.
Calculating the Z-score using linear interpolation
Given that the Z-table does not list the exact cumulative area for a 92% confidence interval which is 0.96, but has 0.9599 (Z = 1.75) and 0.9608 (Z = 1.76), we can interpolate to estimate the Z-score.
- Identify Lower and Upper Bounds:
- Lower bound Z-score (Z1) = 1.75 with a cumulative area of 0.9599.
- Upper bound Z-score (Z2) = 1.76 with a cumulative area of 0.9608.
- Determine the Cumulative Area You Need (A):
- A = 0.96 (the target cumulative area for a 92% CI).
- Calculate the Difference in Area and Z-scores:
- Difference in cumulative area (ΔA) = 0.9608 – 0.9599= 0.009.
- Difference in Z-scores (ΔZ) = 1.76 – 1.75 = 0.01.
- Calculate the Proportion of Your Area Within the Interval:
- Proportion (P) = (A – 0.9599) / ΔA = (0.96 – 0.9599) / 0.0009 = 0.11111111111
- Estimate the Z-score:
- Estimated Z = Z1 + (P * ΔZ) = 1.75+ 0.11111111111 * 0.01 = 1.75111111111
For most general purposes, educational contexts, and preliminary analyses, using an approximation like 1.75 for a 92% confidence interval is entirely adequate. However, for rigorous scientific research, publishing, or any situation where the accuracy of your results is paramount, taking the extra step to calculate the exact Z-score is the best approach.