A confidence interval (CI) is a range of values, derived from sample statistics, that likely contains the true population parameter. This range quantifies the uncertainty around the parameter estimate, typically a mean or proportion. The width of the CI depends on the desired confidence level (commonly 95% or 99%), the variability in the data, and the sample size.
Choose the Correct Confidence Interval Function
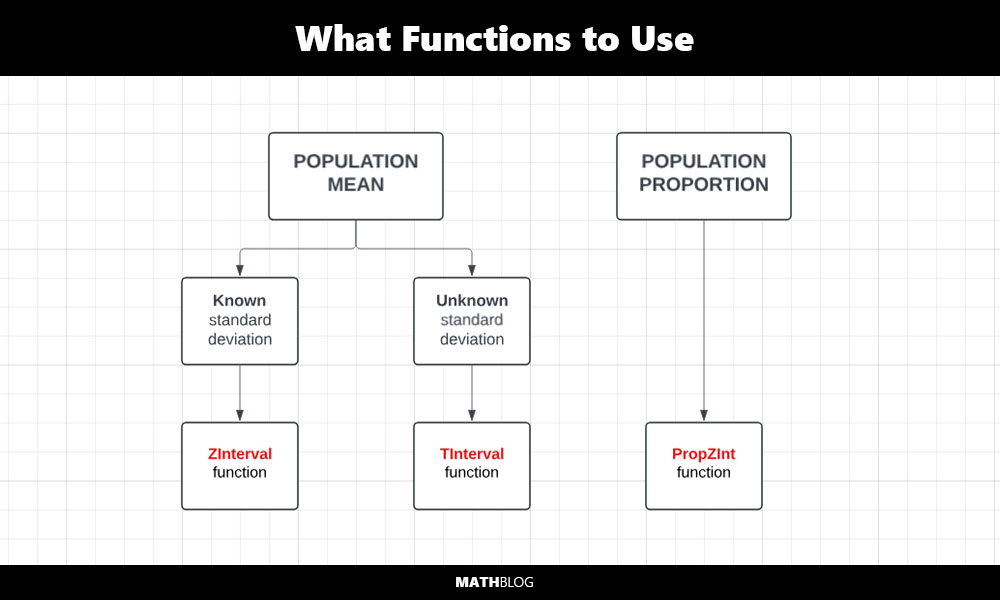
To calculate a CI on a TI-84 calculator, first determine the necessary statistics:
- For a population mean with known standard deviation, use the ZInterval function.
- For a population mean with unknown standard deviation, use the TInterval function.
- For a population proportion, use the 1-PropZInt function.
Understanding the Difference Between DATA and STATS on the TI-84 Calculator
When calculating a confidence interval on the TI-84, you need to choose the right input mode based on the type of data you have. The calculator differentiates between “DATA” and “STATS,” which are selected based on how your data is organized and what is available for your analysis:
- DATA: This option is used when you have raw data points. For instance, if you conducted a survey and collected individual responses, you would input these individual data points into a list on your calculator. You will need to store your raw data in one of the list variables (e.g., L1, L2) and specify this list when setting up your calculation on the TI-84.
- STATS: Use this option when you do not have raw data but have summary statistics such as the mean, standard deviation, and sample size. This is typical in situations where you are given a summary of data, for example, results reported in research papers or data summaries provided for analysis exercises.
Calculating CI for a Population Mean with Known Standard Deviation
Suppose you want to estimate the population mean of a normally distributed variable. You collected a sample of 30 observations with a mean (x̄) of 20 and a known population standard deviation (σ) of 4.
Procedure on the TI-84:
- Press
STATand then scroll right toTESTS.
- Select
7:ZIntervalif you have summary statistics or select the appropriate option for raw data. - Enter the following (Choose Stats)
- σ: 4
- x̄: 20
- n: 30
- C-Level: 0.95
- Select
Calculateand pressENTER.


The TI-84 will compute the 95% confidence interval for the mean : (18.569, 21.431), indicating that the true population mean is expected to fall within this range 95% of the time if the sampling process were repeated.
Calculating CI for a Population Mean with Raw Data
Suppose you collected a sample from a normal distribution with the following individual data points: {2, 4, 5, 7, 11, 12, 14, 15, 18}. You want to construct a 95% confidence interval for the true population mean based on this sample.
Procedure on the TI-84:
- Press
STATand choose1:Edit...to enter your data into list L1.
- Press
STATagain, then scroll right toTESTS. - Select
8:TIntervalfor calculating the interval with raw data. - Enter the following:
- List: L1 (where your data is stored).
- Freq: 1 (assuming each entry occurs once, which is typical unless specified).
- C-Level: 0.95 (for a 95% confidence level).
- Highlight
Calculateand pressENTER


The TI-84 will calculate the 95% confidence interval for the mean based on your data. The output is (5.5365, 14.019), suggesting that the true population mean is likely to fall within this range 95% of the time if the sampling process were repeated.
Note: If your data has repeated values, you can optimize data entry by using a frequency list. For example, if your data set includes multiple occurrences of the same number (e.g., {0, 0, 0, 0, 1, 1, 1, 2, 3, 3, 3, 3, 3, 4, 5}), you can enter the distinct data points in L1 ({0, 1, 2, 3, 4, 5}) and their corresponding frequencies in L2 ({4, 3, 1, 5, 1, 1}). When setting up your confidence interval calculation, specify L1 as the List and L2 as the Freq. This method simplifies data entry and calculations, especially with larger datasets.
Calculating CI for a Population Mean with Unknown Standard Deviation
Suppose you want to estimate the population mean of a normally distributed variable. You collected a sample of 25 observations with a mean (x̄) of 78 and an unknown population standard deviation, but the sample standard deviation (Sx) is known to be 10.
Procedure on the TI-84:
- Press
STATand then scroll right toTESTS. - Select
8:TIntervalif you are working with summary statistics. - Enter the following:
- x̄: 78
- Sx: 10
- n: 25
- C-Level: 0.95
- Select
Calculateand pressENTER.
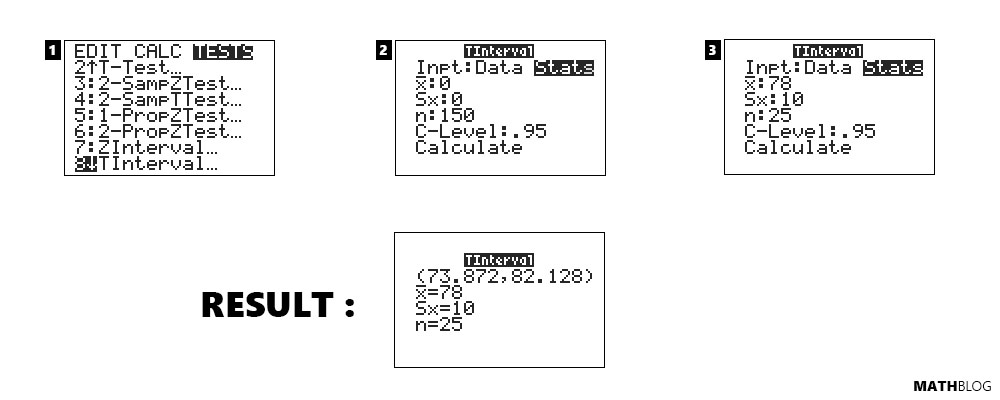
The TI-84 will compute the 95% confidence interval for the mean: (73.872, 82.128), indicating that the true population mean is expected to fall within this range 95% of the time if the sampling process were repeated.
Calculating CI for a Population Proportion
Suppose in a survey, 45 out of 150 respondents agree with a certain statement, and you wish to estimate the proportion of the general population that would agree.
Procedure on the TI-84:
- Press
STATand then scroll right toTESTS. - Select
1-PropZInt(Note: you need to scroll down) - Enter the following:
- x: 45 (number of successes)
- n: 150 (sample size)
- C-Level: 0.95
- Select
Calculateand pressENTER.


The calculator will provide the 95% confidence interval for the proportion: (0.22666, 0.37334), suggesting that between 22.666% and 37.334% of the population might agree with the statement under the standard confidence level assumption.
Key Points to Remember
- Ensure data appropriateness: the data should meet the normality assumption, especially for small sample sizes when using the ZInterval.
- Interpretation: The confidence level indicates the degree of certainty in the interval estimate; it is not a probability that the parameter falls within the interval for a given sample.
- Use of functions: Always select the correct calculator function based on the data (summary statistics vs. raw data) and parameter of interest (mean vs. proportion).
By following these steps, you can effectively use your TI-84 calculator to perform statistical inference, providing you with a robust tool to handle various types of data and research scenarios.