To calculate Z-scores in Excel or Google Sheets you will need to calculate the mean and the standard deviation of your dataset. The built in functions of Excel and Google Sheets will help you with that, you’ll just need to use them correctly.
Let’s assume a car company has 30 dealerships, and they know exactly what each delership sells in a year.
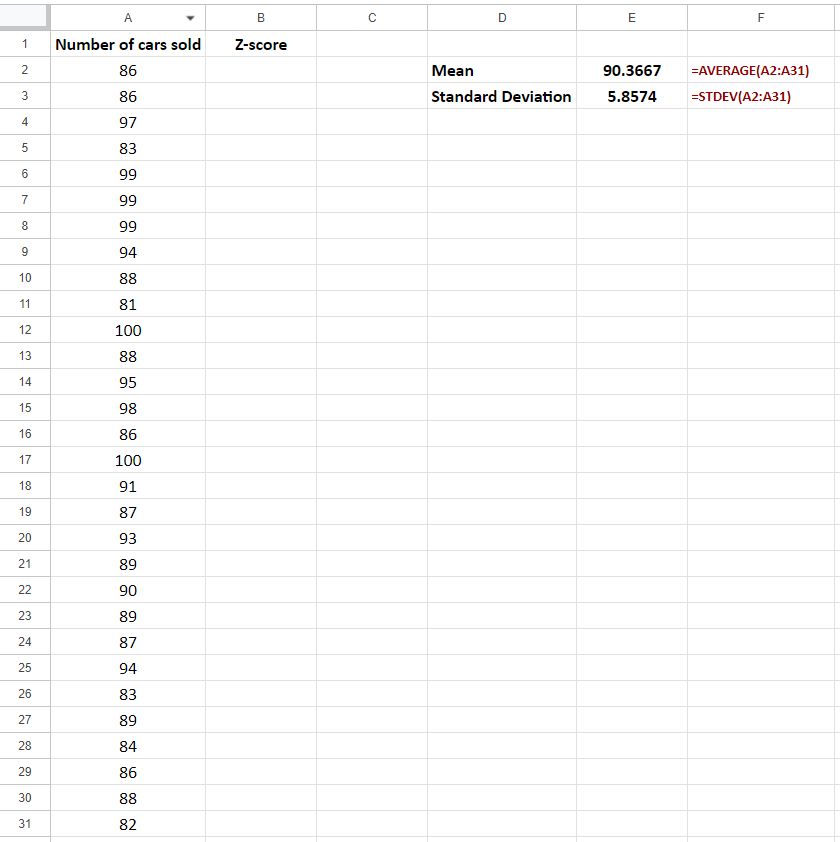
Step 1: Calculate the mean and standard deviation by using the following formulas:
- mean:
=AVERAGE(range) - standard deviation:
=STDEV(range)
Note: If our dataset is a population, use=STDEV.P(range)
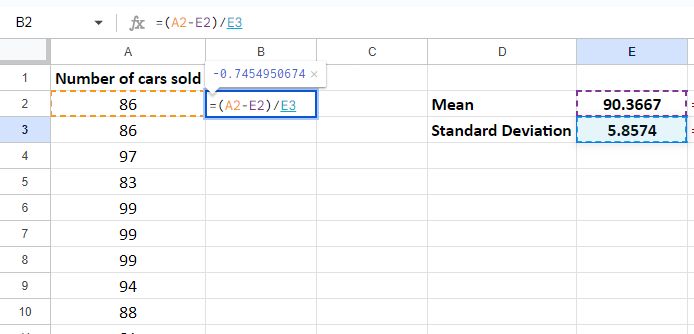
Step 2: Calculate the Z-score
Now that we know the mean (
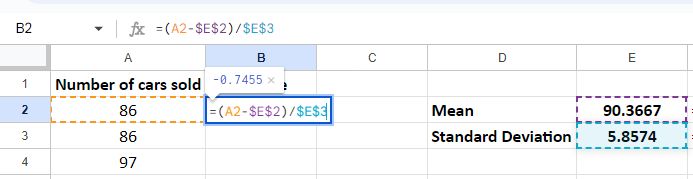
In order to drag the formula down we need to make sure the mean and the standard deviation values are not modified. We’re going to block the cells by using $.
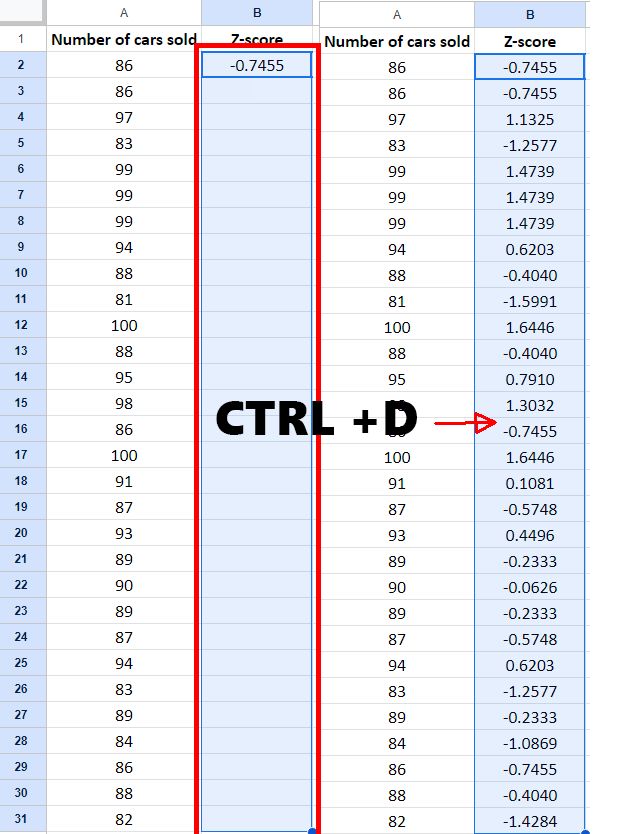
Next, we select the range we want to calculate the Z-score for, making sure that the first formula is where you start your selection, and hit CTRL + D. This will copy our B2 cell formula to the whole range.
Do note that Z-scores can be negative, positive or equal to zero. If a Z-score is below zero it suggests that a specific value is below the average, while a Z-score above zero shows that it exceeds the average. If the Z-score is zero, it means that the value is exactly the same as the mean.
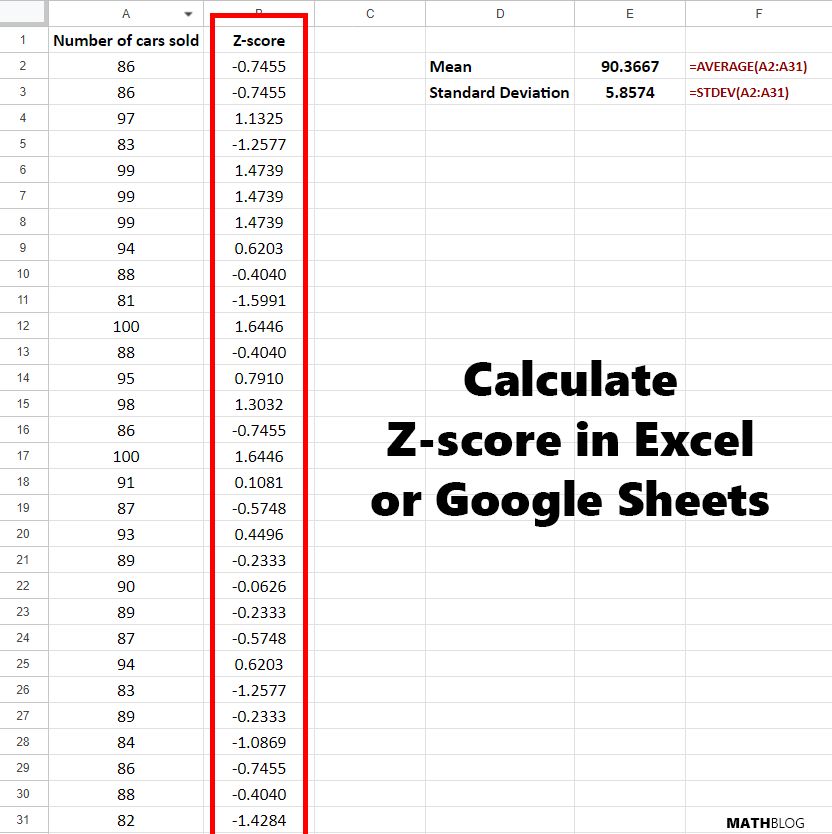
In our example, we found that the mean is 90.3667 and the standard deviation is 5.8574.
The initial number of cars sold from our dataset was 86, which yielded a Z-score of (86−90.3667)/5.8574=−0.7455. This indicates that the value “86” is -0.7455 standard deviations below the mean. Our third entry, 97 cars sold, had a Z-score of (97−90.3667)/5.8574=1.1325. This means that the value “97” is 1.1325 standard deviations above the mean.
The distance of a value from the mean is directly proportional to the absolute value of its Z-score. For instance, the sales figure of 86 is closer to the mean (90.3667) and thus has a smaller absolute Z-score compared to the sales figure of 97, which is further from the mean and consequently has a higher positive Z-score. This demonstrates how the Z-score can reflect both the direction and the magnitude of the deviation from the mean.