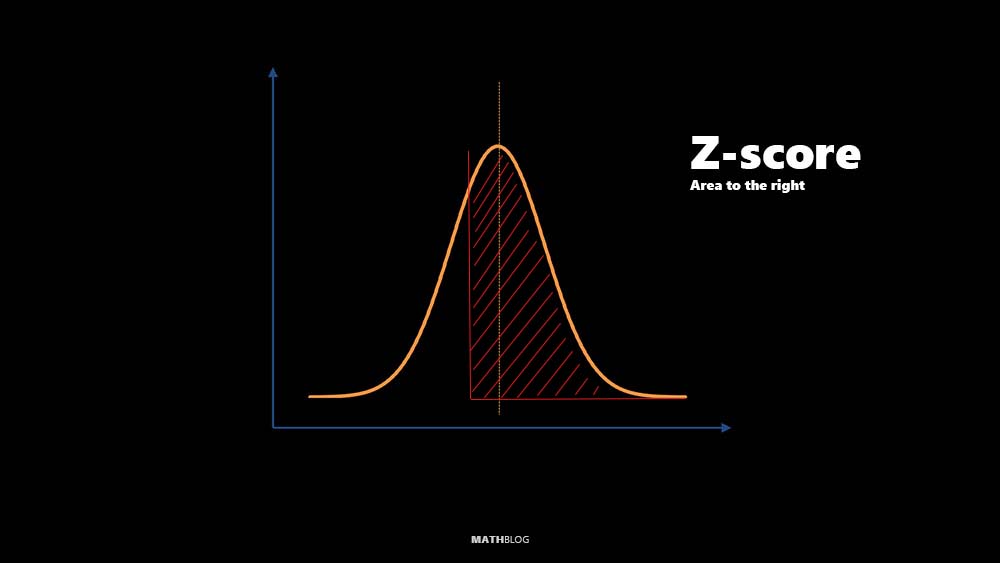
To find the area to the right of a Z-score in the context of a standard normal distribution, you’re essentially looking for the probability that a value will fall above a certain point on the bell curve. This process involves using a Z-table, statistical software, or a calculator that provides the cumulative distribution function (CDF) for the standard normal distribution.
How to Find the Area to the Right of a Z score
The steps outlined below guide you through this process, assuming you’re starting with a known Z-score.
Understand Your Z-score
The Z-score represents how many standard deviations an element is from the mean. If you have a Z-score, it means you have already standardized your value, making it ready for comparison against the standard normal distribution.
Utilize a Z-table or Statistical Software
- Using a Z-table: Z-tables give you the area to the left of a Z-score in a standard normal distribution. To find the area to the right, you’ll subtract the table value from 1. For example, if the Z-score is 1.5, and the Z-table gives you an area of 0.9332 to the left of the Z-score, the area to the right is 1 – 0.9332 = 0.0668.
- Using Statistical Software or a Calculator: Many modern calculators and statistical software packages can directly compute the area to the right of a Z-score. You simply input your Z-score, and select the appropriate function to find the cumulative area to the right.
Interpret the Result
The result you get is the probability of a value falling above your given Z-score in the standard normal distribution. This area is crucial for understanding the likelihood of outcomes in many statistical analyses and experiments. For instance, it allows researchers to determine how extreme a particular observation is within a dataset, assess the significance of experimental results, and calculate confidence intervals. In practical terms, knowing this area helps in evaluating the rarity or commonality of an event, thereby guiding strategic planning, risk assessment, and hypothesis testing in fields ranging from business analytics to scientific research.
Area to the right of Z-score Calculator
Use this calculator to determine the area to the right of a specified z-score within the normal distribution curve. Input the z-score and hit the "Calculate" button.
Practical Example: Evaluating Test Scores
Scenario: Imagine you are a teacher analyzing the results of a standardized test where the scores are normally distributed. The mean score is 500 with a standard deviation of 100. A student scores 650 on this test, and you wish to determine how this student performed relative to their peers.
Objective: Find the percentage of students who scored below and above this student to assess their performance.
STEP 1: Calculate the Z-score
First, calculate the Z-score of the student’s score to standardize it. The formula for a Z-score is:
where X is the score in question, μ is the mean score, and σ is the standard deviation.
For our student:
STEP 2: Calculate the Area to the Right
Look in the z-table for the given z-value of 1.5. To look up this value in the z-table, you would find the intersection in a comprehensive table that includes our Z-score. The excerpt below illustrates a hypothetical result for a Z-score of 1.5 (1.5 in the left-hand column and 0.00 at the top, since we’re dealing with a whole Z-score without decimal extension). The intersection is 0.9332 for this example, representing the cumulative probability to the left of Z = 1.5.
| z | 0.00 | 0.01 | 0.02 | 0.03 | 0.04 | 0.05 | 0.06 | 0.07 | 0.08 | 0.09 |
|---|---|---|---|---|---|---|---|---|---|---|
| 1.1 | 0.8643 | 0.8659 | 0.8675 | 0.8690 | 0.8706 | 0.8721 | 0.8736 | 0.8751 | 0.8765 | 0.8780 |
| 1.2 | 0.8849 | 0.8864 | 0.8879 | 0.8894 | 0.8908 | 0.8922 | 0.8936 | 0.8950 | 0.8964 | 0.8977 |
| 1.3 | 0.9032 | 0.9044 | 0.9057 | 0.9069 | 0.9082 | 0.9094 | 0.9106 | 0.9118 | 0.9130 | 0.9141 |
| 1.4 | 0.9192 | 0.9207 | 0.9222 | 0.9236 | 0.9251 | 0.9265 | 0.9279 | 0.9292 | 0.9306 | 0.9319 |
| 1.5 | 0.9332 | 0.9345 | 0.9357 | 0.9370 | 0.9382 | 0.9394 | 0.9406 | 0.9418 | 0.9430 | 0.9441 |
| 1.6 | 0.9452 | 0.9463 | 0.9474 | 0.9484 | 0.9495 | 0.9505 | 0.9515 | 0.9525 | 0.9535 | 0.9545 |
| 1.7 | 0.9554 | 0.9564 | 0.9573 | 0.9582 | 0.9591 | 0.9599 | 0.9608 | 0.9616 | 0.9625 | 0.9633 |
To find the area to the right (or the percentage of students who scored above 650), subtract the area to the left from 1.
That means the area to the right = 1 − 0.9332 = 0.0668. This result tells us that 6.68% of students scored above 650.
STEP 3: Interpretation
From these calculations, you can conclude that the student who scored 650 is in the top 6.68% of their peers, indicating a high performance compared to the general population of students taking this test.
Additional Notes
- Precision: The precision of your answer depends on the method you’re using. Z-tables typically provide values up to four decimal places, while software can offer more precision.
- Negative Z-scores: If your Z-score is negative, indicating it falls below the mean, remember that the area to the right is greater than 0.5 since over half the distribution lies to the right of any point below the mean.
- Other Distributions: While this article focuses on the standard normal distribution, the concept applies to any normal distribution with the appropriate adjustments for its mean and standard deviation.