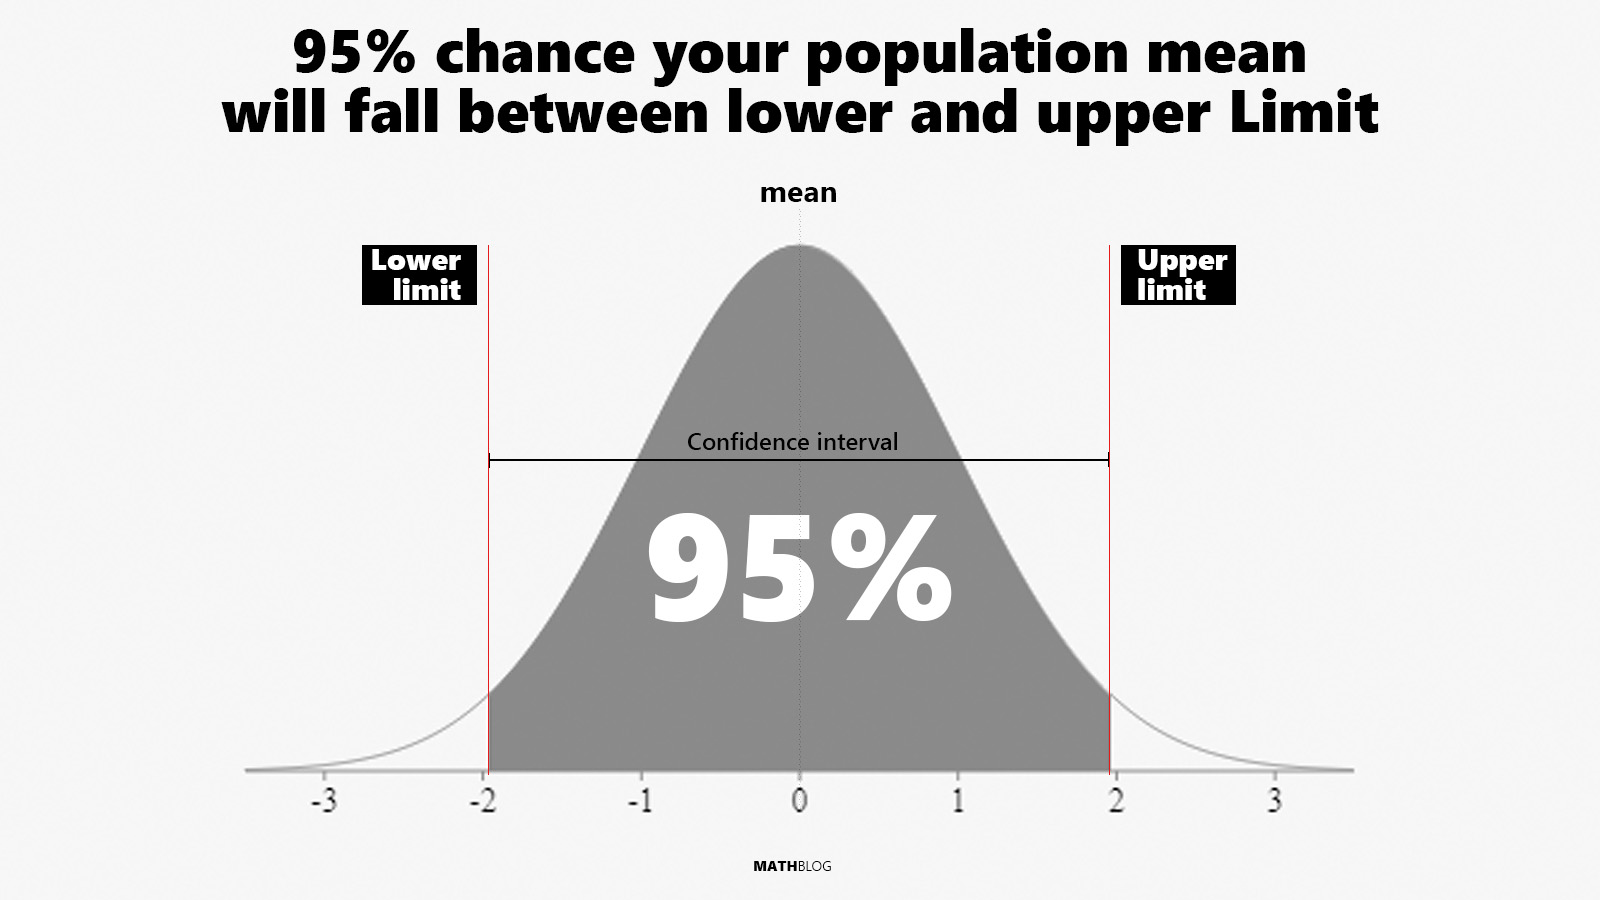
A confidence interval is a statistical tool utilized to indicate the range of values in which a population parameter, such as a mean or proportion, is estimated. This range is typically expressed as a lower and upper bound, with a corresponding level of confidence. The level of confidence, often denoted as a percentage (such as 95%), indicates the probability that the true population parameter falls within the calculated interval.
The 95% confidence interval provides researchers with a high level of confidence that the true population parameter is included within the interval, striking a balance between precision and practicality. This statistical tool allows for valuable inferences and helps assess estimability issues when modeling data across disciplines.
Confidence Interval vs Credibility Interval
The differences between confidence intervals and credibility intervals lie in interpretation and calculation. Confidence intervals focus on the long-term frequency properties of the estimator, while credibility intervals offer a probability statement about the parameter based on current data and prior knowledge.
- Confidence Intervals (CI), are calculated based on the idea that if an experiment were repeated numerous times, a certain percentage (like 95%) of the calculated intervals would contain the true parameter value. The CI is all about the methodology and the long-term frequency properties of the estimator. It does not assign a probability to the parameter itself being within the interval in any specific experiment.
- Credibility Intervals (Bayesian CI), from Bayesian statistics, provide a probability that the parameter is within the interval, based on the observed data and prior beliefs or knowledge. This interval is calculated from the posterior distribution, a combination of the likelihood of the observed data and a prior distribution, reflecting pre-existing beliefs or information about the parameter. It allows for a more direct probabilistic interpretation of where the parameter lies based on the current data and prior information.
Below is a comparative table with the fundamental differences between confidence intervals and credibility intervals in terms of their definition, philosophical basis, computation methods, interpretation, sensitivity to sample size, use of prior information, and typical contexts in which they are applied.
| Aspect | Confidence Interval | Bayesian Credibility Interval |
|---|---|---|
| Definition | An interval estimate of a parameter that provides a range of plausible values with a specified probability (usually 95%) that the parameter lies within this range, assuming the data are sampled from the population. | An interval estimate of a parameter that represents the range of values within which the parameter is likely to fall, with a certain degree of belief (or probability), based on the observed data and prior information. |
| Philosophical Basis | Frequentist approach; focuses on the long-run frequency properties of the estimator. | Bayesian approach; incorporates prior beliefs or information along with the likelihood of the observed data. |
| Computation | Based on sampling distribution of the estimator and does not require prior information about the parameter. | Based on the posterior distribution of the parameter, which combines the likelihood of the observed data with the prior distribution. |
| Interpretation | The interval has a certain probability (e.g., 95%) of containing the true parameter value in repeated samples. It does not assign a probability to the parameter itself. | The parameter has a certain probability (e.g., 95%) of being within the interval, given the data and the prior. It provides a probabilistic statement about the parameter itself. |
| Sensitivity to Sample Size | Can be more influenced by sample size; larger samples tend to produce narrower intervals. | Also influenced by sample size, but the effect is moderated by the strength of the prior beliefs. |
| Prior Information | Does not incorporate prior information about the parameter. | Explicitly incorporates prior information or beliefs about the parameter. |
| Example Contexts | Common in frequentist statistics, like in clinical trials or surveys. | Often used in Bayesian analysis, such as in hierarchical models or when prior information is available. |
How to Calculate the 95% Confidence Interval
The formula for calculating a 95-percent confidence interval depends on whether you’re estimating a mean or a proportion and whether you’re using the standard deviation of the population (which is often unknown) or the standard deviation of your sample. The formula for constructing a 95% confidence interval around a point estimate in statistics is:
Confidence Interval = Point Estimate ± (Critical Value × Standard Error)
where:
- Point Estimate: This is the calculated value that estimates the parameter of interest. It’s derived from the sample data. Common examples are the sample mean or sample proportion.
- Critical Value: This is a number from a statistical distribution that corresponds to the desired level of confidence. For a 95% confidence interval, the critical value is often taken from either the Z-distribution (standard normal distribution) or the t-distribution.
- In the case of a large sample size or known population variance, the critical value is typically the Z-score (approximately 1.96 for 95% confidence).
- For smaller samples or unknown population variance, the critical value is the t-score, which depends on the sample size (or degrees of freedom).
- Standard Error: This is a measure of the standard deviation of the sampling distribution of the point estimate. It’s an estimate of how much variability you can expect in the point estimate from sample to sample. The standard error of the mean, for example, is calculated as the sample standard deviation divided by the square root of the sample size.
To compute the upper and lower bounds of a confidence interval, it’s essential to use the appropriate Z-score that corresponds with your selected confidence level.
| Confidence Level | Z-Score |
|---|---|
| 90% (0.90) | 1.645 |
| 95% (0.95) | 1.96 |
| 99% (0.99) | 2.58 |
Using Standard Deviation (for a large sample or known population variance) the CI formula is:
- ¯¯¯x is the sample mean
- Z is the Z-score corresponding to the desired confidence level (for 95%, it’s typically 1.96)
- σ is the population standard deviation
- n is the sample size.
Using Standard Error (for a smaller sample with unknown population variance) the CI formula is:
- ¯¯¯x is the sample mean
- t is the t-score from the t-distribution corresponding to the desired confidence level and degrees of freedom (n-1)
- s is the sample standard deviation
- n is the sample size.
Calculation of a 95% Confidence Interval (Example)
Imagine a study measuring the average height of a sample of 100 adult males. The sample mean height (Point Estimate) is found to be 175 cm, and the sample standard deviation (s) is 8 cm. Since the population standard deviation is unknown and the sample size is large, we use the Z-score for a 95% confidence level, which is approximately 1.96.
Using the formula for the confidence interval:
The 95% confidence interval for the average height is approximately 173.43 cm to 176.57 cm. This means we are 95% confident that the true average height of the adult male population falls within this range.
Note: The MathBlog confidence interval calculator is a tool designed to simply calculating CIs.
What Does the 95-percent Confidence Interval Tell?
We’re using another example to explain what the 95-percent confidence interval tells us. Let’s consider that a market research firm conducts a survey to determine the percentage of consumers interested in a new type of eco-friendly packaging. This kind of research is highly important for companies looking to invest in sustainable packaging solutions and understanding consumer trends.
The survey finds that 65 percent of consumers are in favor of the new eco-friendly packaging. The research, conducted via online questionnaires, gathered responses from 1,200 consumers. The results have a reported margin of error of plus or minus 4 percentage points.
While not explicitly stated, this margin of error likely corresponds to a 95 percent confidence interval. In simpler terms, this suggests there is a 95 percent chance that the actual percentage of consumers who favor eco-friendly packaging falls between 61 percent (65 percent minus 4 percent) and 69 percent (65 percent plus 4 percent).
From a statistical standpoint, if the survey would berepeated 100 times under similar conditions, in 95 of those surveys, the percentage of consumers favoring eco-friendly packaging would be expected to fall within this calculated confidence interval. Conversely, in 5 of those surveys, the percentage could fall outside this range.
Also worth noting, there are different levels of confidence that can be used based on the desired degree of certainty:
- A 90 percent confidence interval would have a smaller margin of error, for instance, plus or minus 3 percent, indicating a higher likelihood of the result falling outside this range.
- A 99 percent confidence interval would be broader, such as plus or minus 5 percent, providing a wider range but with greater certainty that the true percentage falls within this interval.