A graph is a visual representation of coordinates that can be found or produced using the Quadratic formula.
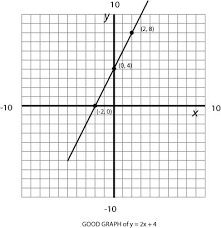
Coordinates are measured according to the area on the graph where they are in relation to the y axis and x axis. Single point on a graph is called a vertex, multiple points are called vertices. Two or more vertices can be measured to find an angle. Three or more vertices can be measured to find a curve.
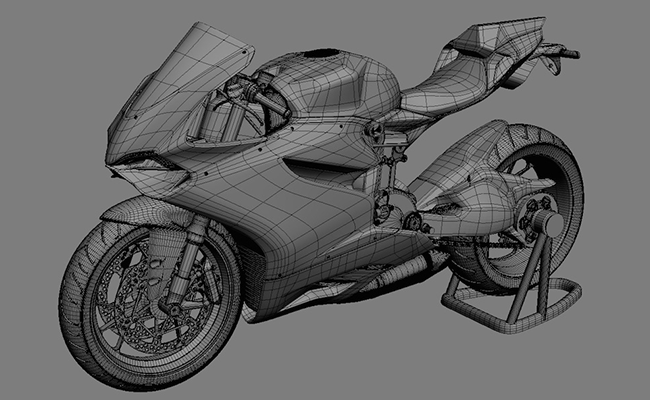
More complex can be graphed to create three dimensional shapes. This method is used in creating video games and other software with the use of special software.

Calculating Vertices
The math behind finding the coordinates for vertices can be complicated. At least two values must be known. If two values are known, they can be plugged into the Quadratic Formula. Any two values will do, as they can be rearranged to find the proper function.
Quadratic equations with three values are used to calculate curves between vertices, which can be used to connect other curves and lines. The standard form of ax2 + bx + c = 0 can contain the values of a curve and used to find other functions once the solutions are factored.
Solving and Inverting Values
When an equation contains a value that needs to be squared, it is a Quadratic equation. The values of a, b, and c are known in the standard form of ax2 + bx + c = 0. By using this form, additional values can be added to create more curves.
If only certain values are known the functions will be inverted and factored to find the values. Using the Quadratic Formula makes it possible to find these values and graph them. This process can also be reversed to find the values from a graph.
Most of these functions can be done by using a graphing calculator, but it’s suggested that the equations be manually solved to gain a better understanding of the math of the Quadratic Formula.
Using Graphs in The Real World
It might be hard to see where this information would be useful, but there are countless applications that require the use of a graph. An example of creating models for video games was mentioned before, but that’s only one example of how graphs are used in the real world.
In computing, a graph isn’t limited to a specific shape or size. Rather, the graph can be finite and mutable. In math, graphs can be used to visually represent data along a series of statements. The construction industry practically depends on graphs to get anything done.
Not only are there many different applications, there are different ways to represent graphs. The data collected from a standard graph can be adapted to line graphs or even pie graphs. These representations can be used to display sales data for businesses, or correlating data between the different departments in the business.
There are limitless options for the application of graphs and how that data can be adapted to real world applications.