This is a brief post showing how to display error bars in GNU Octave, a free open-source numerical programming and analysis tool that is mostly compatible with MATLAB. Octave can display standard two dimensional plots using the plot command. Unfortunately, plot does not support error bars. Fortunately, Octave has an errorbar command which can display error bars.
This post shows how to combine the raw data plotted with the Octave plot command with a polynomial model fit to the data with the error bars on the polynomial fit results from the Octave polyfit command. The post uses the data from the US Centers for Disease Control (CDC) Autism Prevalence Summary Table for 2011, a survey of studies of the prevalence of autism spectrum disorders throughout the world.
%
%   Script to display CDC Austism Prevalence Summary Table 2011 Data and Model Fit Results with Error Bars
%   Author: John F. McGowan, Ph.D.  (jmcgowan11@earthlink.net)
%
%   (C) 2012 John F. McGowan, Ph.D.
%
autism_data = dlmread('autism_prevalence_2011.txt', '\t');
dates = real(autism_data(:,4));  % time period studied
country = autism_data(:,3);    % country code usa is 1
valid = find(country >= 1);
usa = find(country == 1);
uk = find(country == 2);
eng = find(country == 3);
sweden = find(country == 4);
canada = find(country == 5);
australia = find(country == 6);
japan = find(country == 7);
germany = find(country == 8);
france = find(country == 9);
ireland = find(country == 10);
denmark = find(country == 11);
sk = find(country == 12);  % South Korea (most extreme autism rate)

diagnosis = autism_data(:, 7); % diagnostic criteria
kanner = find(diagnosis == 1);
dsm3 = find(diagnosis == 2);
dsm4 = find(diagnosis == 5);
icd10 = find(diagnosis == 4);

prevalence = real(autism_data(:,9));

[p_autism, s] = polyfit(dates(valid), prevalence(valid), 3);
% variable s contains error parameters from polynomial fit
mydates = 1960:2012;
[simrate_world, dsimrate_world] = polyval(p_autism, mydates, s);

[p_usa, s_usa] = polyfit(dates(usa), prevalence(usa), 3);
% variable s_usa contains error parameters from polynomial fit
[fit_usa, dfit] = polyval(p_usa, mydates, s_usa);

figure(1)
h1 = plot(dates(usa), prevalence(usa), 'o', mydates);
set(h1, 'linewidth', 3);
axis([1960 2012 0.0 10.0]);
hold on;  % hold plot and exes so can overlay errorbar plot on same graphic
ylabel('cases per 1000 children', 'fontsize', 14)
xlabel('Year',  'fontsize', 14)
title('Autism Spectrum Disorder Prevalence (USA)',  'fontsize', 14);
legend('DATA', 'location', 'northwest');
legend('boxon');  % turn on box around legend
errorbar(mydates, fit_usa, dfit);  % display fit results with error bars
print('usa_autism_errors.jpg');
hold off;   % turn off hold so can create a separate plot of world data

figure(2)
h2 = plot(dates(usa), prevalence(usa), 'ob',
dates(uk), prevalence(uk), 'or',
dates(sweden), prevalence(sweden), 'ok',
dates(denmark), prevalence(denmark), '*b',
dates(japan), prevalence(japan), '*r',
dates(eng), prevalence(eng), '*k',
dates(france), prevalence(france), '+b',
dates(germany), prevalence(germany), '+r',
dates(canada), prevalence(canada), '+k',
dates(australia), prevalence(australia), 'xb',
dates(ireland), prevalence(ireland), 'xr',
dates(sk), prevalence(sk), 'xk');

set(h2, 'linewidth', 3);
axis([1960 2012 0.0 30.0]);
hold on;
ylabel('cases per 1000 children',  'fontsize', 14)
xlabel('Year',  'fontsize', 14)
title('Autism Spectrum Disorder Prevalence (By Country)',  'fontsize', 14);
legend('USA', 'UK', 'SWEDEN', 'DENMARK', 'JAPAN', 'ENGLAND', 'FRANCE',
'GERMANY', 'CANADA', 'AUSTRALIA', 'IRELAND', 'SOUTH KOREA',
'location', 'northwest');
legend('boxon');  % turn on box around legend
errorbar(mydates, simrate_world, dsimrate_world);  % add fit results with error bars
print('autism_by_nation_errors.jpg');

hold off;  % for future
disp('ALL DONE');
Note, in particular, the use of the commands hold on and hold off to combine the graphical outputs of the plot and errorbar commands in a single graph. Hold on keeps the graphics and axes of the figure, so that the errorbar command does not overwrite/erase the plot. Once the figure is created with both the raw data and error bars, hold off is used to return the figure to normal behavior so an entirely new plot can be created. Also, note the syntax:
[p, s] = polyfit(x, y, n)
which returns an estimate of errors in the s structure from fitting a polynomial of degreee n to the data x and y.
The syntax:
[y, dy] = polyval(p, x, s)
evaluates the polynomial with coefficients p and error parameters s for the values x, putting the resulting values in y and the error bars (one standard deviation) in dy.
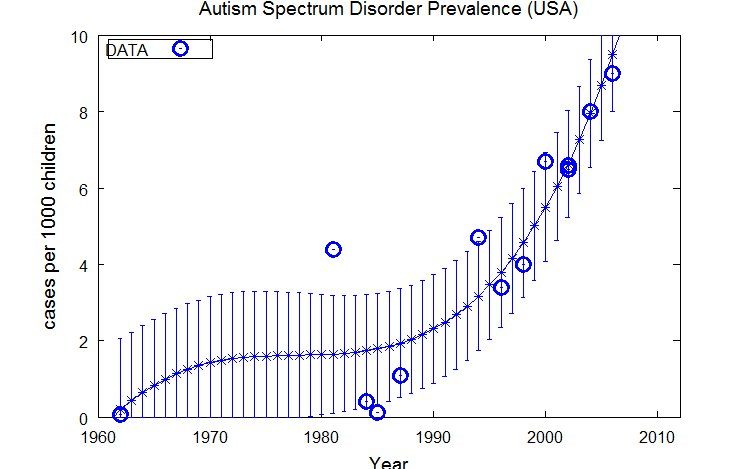
This Octave code makes the following plots with error bars displayed.
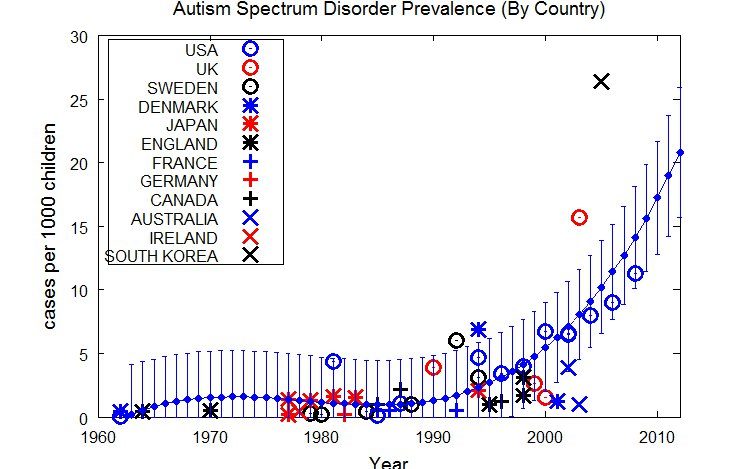
The second plot shows the error bars for a fit to the worldwide autism spectrum disorder prevalence data.
Conclusion
Octave can display plots with error bars using the errorbar command or the plot and errorbar commands combined as illustrated above. In particular, the Octave plot and errorbar commands can be combined to display original data and the results of fitting a model including the error bars returned by the model, using the Octave polyfit polynomial fitting command for example.
© 2012 John F. McGowan
About the Author
John F. McGowan, Ph.D. solves problems using mathematics and mathematical software, including developing video compression and speech recognition technologies. He has extensive experience developing software in C, C++, Visual Basic, Mathematica, MATLAB, and many other programming languages. He is probably best known for his AVI Overview, an Internet FAQ (Frequently Asked Questions) on the Microsoft AVI (Audio Video Interleave) file format. He has worked as a contractor at NASA Ames Research Center involved in the research and development of image and video processing algorithms and technology. He has published articles on the origin and evolution of life, the exploration of Mars (anticipating the discovery of methane on Mars), and cheap access to space. He has a Ph.D. in physics from the University of Illinois at Urbana-Champaign and a B.S. in physics from the California Institute of Technology (Caltech). He can be reached at jmcgowan11@earthlink.net.
Appendix I: Autism Prevalence Summary Table for 2011 Data
Author	Year published	Country	Time period studied	Age range studied	Number of children in population	Criteria used	Methodology used	ASD prevalence (CI)	IQ<70 (%)
Lotter	1966	3	1964	8 to 10	78,000	1	Case enumeration and direct exam	0.45 (0.31-0.62)	84
Brask	1970	11	1962	2 to 14	46,500	1	Case enumeration	0.43 (0.26-0.66)	NR
Treffert	1970	1	1962-1967	3 to 12	899,750	1	Case enumeration	0.07-0.31 (0.0-1.0)	NR
Wing & Gould	1979	3	1970	0 to 14	35,000	1	Case enumeration and direct exam	0.49 (0.29-0.78)	70
Hoshino et al. (1)	1982	7	1977	0 to 17	234,039	1	Case enumeration and direct exam	0.23 (0.19-0.27)	NR
Ishii & Takahashi	1983	7	1981	6 to 12	35,000	Rutter	Case enumeration and direct exam	1.6 (1.2-2.8)	NR
Bohman et al.	1983	4	1979	0 to 20	69,000	Rutter	Case enumeration and direct exam	0.3 (0.2-0.5)	NR
McCarthy et al.	1984	10	1978	8 to 10	65,000	1	Case enumeration and direct exam	0.43 (0.29-0.59)	NR
Gillberg	1984	4	1980	4 to 18	128,584	2	Case enumeration and direct exam	0.20 (0.13-0.30)	80, 77
Steinhausen et al.	1986	8	1982	0 to 14	279,616	Rutter	Case enumeration and direct exam	0.19 (0.14-0.24)	44
Author	Year published	Country	Time period studied	Age range studied	Number of children in population	Criteria used	Methodology used	ASD prevalence (CI)	IQ<70 (%)
Steffenberg & Gillberg	1986	4	1984	<10	78,413	2	Case enumeration and direct exam	0.45 (0.31-0.62)	NR
Matsuishi et al.	1987	7	1983	4 to 12	32,834	2	Case enumeration and direct exam	1.55 (1.16-1.64)	NR
Burd et al.	1987	1	1985	2 to 18	180,986	2	Case enumeration and direct exam	0.12 (0.00-0.20)	NR
Bryson et al.	1988	5	1985	6 to 14	20,800	2	Case enumeration and direct exam	1.01 (0.62-1.54)	76
Tanoue et al.	1988	7	1977-1985	3 to 7	95,394	2	Case enumeration	1.38 (1.16-1.64)	NR
Ciadella & Mamelle	1989	9	1986	3 to 9	135,180	2	Case enumeration	0.51 (0.39-0.63)	NR
Sugiyama & Abe	1989	7	1979-1984	2 to 5	12,263	2	Population screen and direct exam	1.3 (0.7-2.1)	38
Ritvo et al.	1989	1	1984-1988	8 to 12	184,822	2	Case enumeration and direct exam	0.40 (0.31-0.50)	NR
Gillberg et al.	1991	4	1988	4 to 13	78,106	3	Case enumeration and direct exam	0.95 (0.74-1.95)	82, 80
Fombonne & Mazaubrun (1)	1992	9	1985	9 to 13	274,816	4	Case enumeration and direct exam	0.49 (0.47-0.65)	87
Honda et al.	1996	7	1994	1.5 to 6	8,537	4	Population screen and direct exam	2.11 (1.25-3.33)	50
Author	Year published	Country	Time period studied	Age range studied	Number of children in population	Criteria used	Methodology used	ASD prevalence (CI)	IQ<70 (%)
Fombonne et al.	1997	9	1992-1993	6 to 16	325,347	4	Case enumeration and direct exam	0.54 (0.46-0.62)	88
Arivdsson et al.	1997	4	1994	3 to 16	1,941	4	Population screen and direct exam	3.10 (1.14-6.72)	100
Webb et al.	1997	Wales	1992	3 to 15	73,300	3	Case enumeration and direct exam	0.72 (0.54-0.95)	NR
Sponheim & Skjeldae	1998	Norway	1992	3 to 14	65,688	4	Case enumeration and direct exam	0.38 (0.25-0.56)	64
Kadesjo et al.	1999	4	1992	6.7 to 7.7	826	4	Case enumeration and direct exam	6.0 (1.97-14.1)	60
Baird et al.	2000	3	1998	1.5 to 8	16,235	4	Population screen and direct exam	3.1 (2.29-4.06)	40
Powell et al.	2000	3	1995	1 to 4	29,200	DSM-III-R or DSM-IV	Case enumeration	0.96 (0.64-1.39)	NR
Kielinen et al.	2000	Finland	1996	5 to 18	152,732	5	Case enumeration	1.22 (1.06-1.41)	50
Magnusson & Saemundsen	2000	Iceland	1997	5 to 14	43,153	4	Population screen and direct exam	0.86 (0.60-1.18)	49
Chakrabarti & Fombonne	2001	3	1998	2.5 to 6.5	15,500	5	Population screen and direct exam	1.68 (1.1-2.46)	24
Fombonne et al. (2)	2001	2	1999	5 to 15	12,529	5	Population screen and direct exam	2.61 (1.81-3.70)	44.4
Author	Year published	Country	Time period studied	Age range studied	Number of children in population	Criteria used	Methodology used	ASD prevalence (CI)	IQ<70 (%)
Bertrand et al.	2001	1	1998	3 to 10	8,996	5	Case enumeration and direct exam	4.0 (2.8-5.5)	49
Croen et al.	2001	1	1987-1999	0 to 21	4,600,000	DSM-III-R or DSM-IV	Case enumeration	1.1 (1.06-1.14)	NR
Yeargin-Allsopp et al. (2)	2003	1	1996	3 to 10	290,000	5	Case enumeration	3.4 (3.2-3.6)	62
Gurney et al. (2)	2003	1	1981-1982, 2001-2002	6 to 17	LEFT_BLANK	5	Case enumeration	4.4 (4.3-4.5)	NR
Lingam et al.	2003	2	2000	5 to 14	186,206	4	Case enumeration	1.5 (1.3-1.7)	NR
Icasiano et al.	2004	6	2002	2 to 17	45,153	5	Case enumeration	3.9 (3.3-4.5)	47
Lauritsen et al.	2004	11	2001	0 to 9	682,397	4	Case enumeration	1.2 (1.1-1.3)	NR
Fombonne et al.	2006	5	1987-1998	5 to 21	27,749	5	Case enumeration	2.16 (1.65-2.78)	NR
Baird et al.	2006	2	1990-1991	9 to 10	56,946	4	Case enumeration, screen, and direct exam	3.89 (3.39-4.43)	56
CDC ADDM Network (1)	2007	1	2000	8	187,761	5	Case enumeration and record review	6.7 (6.3-7.0)	36-61
CDC ADDM Network (1)	2007	1	2002	8	444,050	5	Case enumeration and record review	6.6 (6.3-6.8)	45
Author	Year published	Country	Time period studied	Age range studied	Number of children in population	Criteria used	Methodology used	ASD prevalence (CI)	IQ<70 (%)
Oullette-Kuntz et al.	2007	5	1996-2004	4 to 9	2,240,537	Special education classification	Case enumeration from special education classification	1.2 (1996), 4.3 (2004)	NR
Wong et al. (1)	2008	Hong Kong	1986-2005	0 to 14	4,247,206	5	Case enumeration	1.6	NR
Williams et al.	2008	6	2003-2004	6 to 12	5,459	5	Questionnaires	1.0 (0.8-1.0) to 4.1 (3.8-4.4)	NR
Montiel-Nava et al.	2008	Venezuela	2005-2006	3 to 9	254,905	5	Case enumeration	1.7 (1.3-2.0)	NR
Baron-Cohen et al.	2009	2	2003-2004	5 to 9	5,484	Special Education Needs register	Case enumeration from survey and direct exam	15.7 (9.9-24.6)	NR
CDC ADDM Network (1)	2009	1	2004	8	172,335	5	Case enumeration and record review	8.0 (7.6-8.4)	44
CDC ADDM Network (1)	2009	1	2006	8	308,038	5	Case enumeration and record review	9.0 (8.6-9.3)	41
Al-Farsi et al.	2010	Oman	2009	0 to 14	798,913	5	Case enumeration	0.1 (0.1-0.2)	NR
Parner et al.	2011	11	1994-1999	LEFT_BLANK	404,816	5	Case enumeration	6.9 (6.5-7.2)	NR
Parner et al.	2011	Western Australia	1994-1999	LEFT_BLANK	152,060	5	Case enumeration	5.1 (4.7-5.5)	NR
Chien et al.	2011	Taiwan	1996-2005	0 to 18	372,642	6	Case enumeration	2.9	NR
Author	Year published	Country	Time period studied	Age range studied	Number of children in population	Criteria used	Methodology used	ASD prevalence (CI)	IQ<70 (%)
Windham et al.	2011	1	1994, 1996	0 to 8	82,153 (1994), 80,249 (1996)	5	Case enumeration	4.7 (4.2-5.1) (1994); 4.7 (4.2-5.2) (1996)	NR
Kim et al.	2011	12	2005-2009	7 to 12	55,266	5	Case enumeration from survey and direct exam	26.4 (19.1-33.7)	59
Zimmerman et al.	2012	1	2002, 2006, 2008	8	26,213 (2002); 29,494 (2006); 33,757 (2008)	ICD-9 and special education classification	Case enumeration	6.5 (2002), 10.2 (2006), 13.0 (2008)	NR
Kocovska et al.	2012	Faroe Islands	2002, 2009	7-16 (2002), 15-24 (2009)	7122 (2002), 7128 (2009)	DSM-IV, ICD-10	Screening and direct exam	5.6 (2002), 9.4 (2009)	NR
CDC ADDM Network (1)	2012	1	2008	8	337,093	5	Case enumeration and record review	11.3 (11.0-11.7)	38
(1) The prevalence reported represents the average. (2) The prevalence study provided overall rate only`


Thank you for all the great posts/tips/how-tos on Octave!
thanks a lot for the tip 🙂