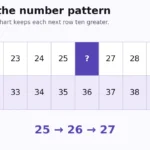
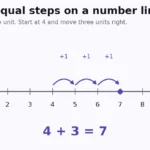
Use a clear numerical layout to support a mathematical explanation. Number charts organize the counting sequence in rows and columns, while number lines place values along an equally spaced scale.
Choose missing-number charts for counting patterns or number-line questions for reading marked positions. The generated worksheet and its completed answer key use the same values and layout.
Choose the representation for the task
A ten-column chart makes adding 1 and adding 10 easy to compare. A number line makes order, distance, and equal intervals visible. Later levels use quarters or signed integers without changing the need for consistent spacing.
Before starting a full set, ask the learner to explain one missing chart cell or one marked point. For a chart blank between 25 and 27, nearby numbers identify 26; the cell below is 36.
Keep a printed chart nearby as a support when helpful, and use an easier question level when the representation itself is still unfamiliar.
Standards and further reading