The Z-Score Percentile table is a great resource for converting percentile ranks into Z-scores within a normal distribution framework. It’s a fundamental component of statistical analysis, streamlining the process of assessing data’s relative position within a normal distribution.
If you don’t want to use the chart above, try our Percentile to Z-score calculator to get an instant answer, or scroll down to this page for the calculators.
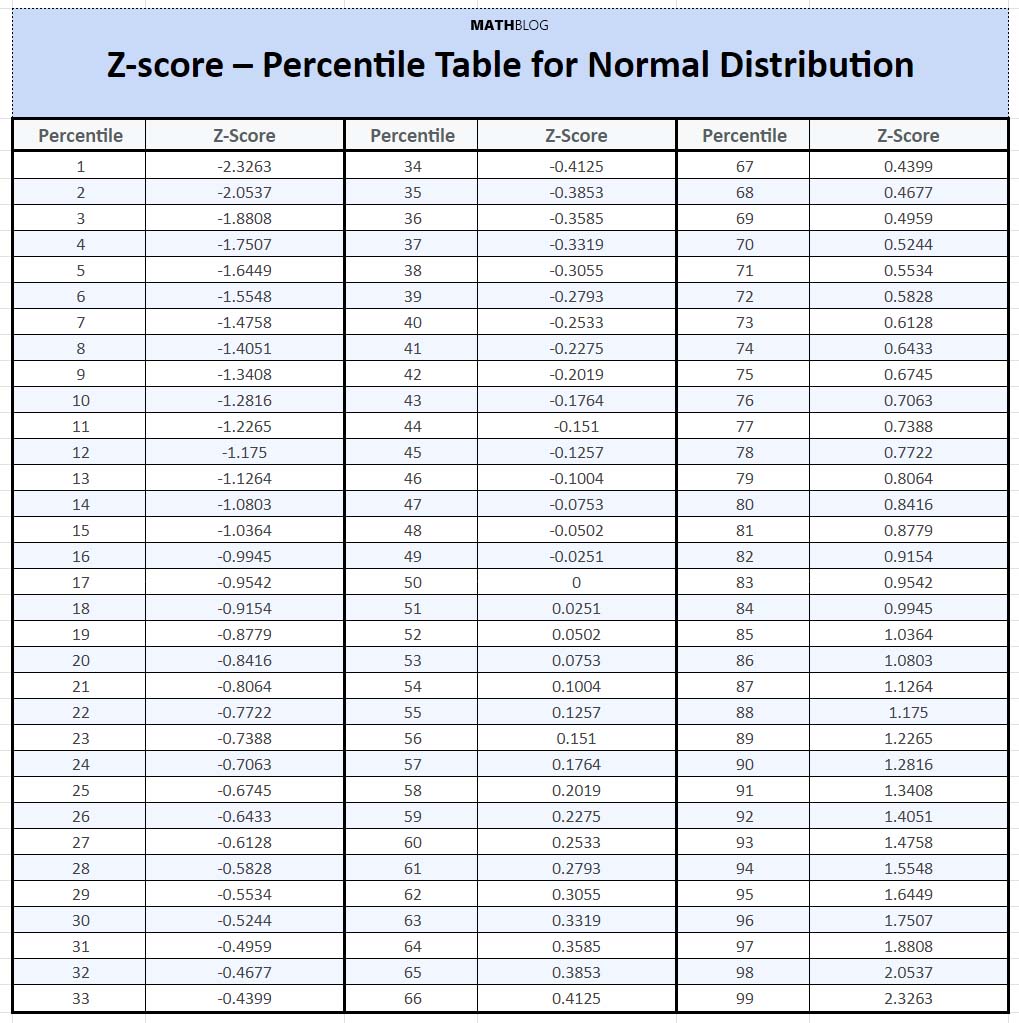
Percentile to Z-Score Conversion Chart (Text Format)
The table below represents a detailed conversion chart that maps Percentiles s to their corresponding Z-scores. It is structured to provide quick access to the Z-score based on the percentile input. This tabular format is especially beneficial for those who prefer a text-based reference (to style it or copy paste) or need to look up multiple values efficiently.
| Percentile | Z-Score |
|---|---|
| 1 | -2.3263 |
| 2 | -2.0537 |
| 3 | -1.8808 |
| 4 | -1.7507 |
| 5 | -1.6449 |
| 6 | -1.5548 |
| 7 | -1.4758 |
| 8 | -1.4051 |
| 9 | -1.3408 |
| 10 | -1.2816 |
| 11 | -1.2265 |
| 12 | -1.1750 |
| 13 | -1.1264 |
| 14 | -1.0803 |
| 15 | -1.0364 |
| 16 | -0.9945 |
| 17 | -0.9542 |
| 18 | -0.9154 |
| 19 | -0.8779 |
| 20 | -0.8416 |
| 21 | -0.8064 |
| 22 | -0.7722 |
| 23 | -0.7388 |
| 24 | -0.7063 |
| 25 | -0.6745 |
| 26 | -0.6433 |
| 27 | -0.6128 |
| 28 | -0.5828 |
| 29 | -0.5534 |
| 30 | -0.5244 |
| 31 | -0.4959 |
| 32 | -0.4677 |
| 33 | -0.4399 |
| 34 | -0.4125 |
| 35 | -0.3853 |
| 36 | -0.3585 |
| 37 | -0.3319 |
| 38 | -0.3055 |
| 39 | -0.2793 |
| 40 | -0.2533 |
| 41 | -0.2275 |
| 42 | -0.2019 |
| 43 | -0.1764 |
| 44 | -0.1510 |
| 45 | -0.1257 |
| 46 | -0.1004 |
| 47 | -0.0753 |
| 48 | -0.0502 |
| 49 | -0.0251 |
| 50 | 0.0000 |
| 51 | 0.0251 |
| 52 | 0.0502 |
| 53 | 0.0753 |
| 54 | 0.1004 |
| 55 | 0.1257 |
| 56 | 0.1510 |
| 57 | 0.1764 |
| 58 | 0.2019 |
| 59 | 0.2275 |
| 60 | 0.2533 |
| 61 | 0.2793 |
| 62 | 0.3055 |
| 63 | 0.3319 |
| 64 | 0.3585 |
| 65 | 0.3853 |
| 66 | 0.4125 |
| 67 | 0.4399 |
| 68 | 0.4677 |
| 69 | 0.4959 |
| 70 | 0.5244 |
| 71 | 0.5534 |
| 72 | 0.5828 |
| 73 | 0.6128 |
| 74 | 0.6433 |
| 75 | 0.6745 |
| 76 | 0.7063 |
| 77 | 0.7388 |
| 78 | 0.7722 |
| 79 | 0.8064 |
| 80 | 0.8416 |
| 81 | 0.8779 |
| 82 | 0.9154 |
| 83 | 0.9542 |
| 84 | 0.9945 |
| 85 | 1.0364 |
| 86 | 1.0803 |
| 87 | 1.1264 |
| 88 | 1.1750 |
| 89 | 1.2265 |
| 90 | 1.2816 |
| 91 | 1.3408 |
| 92 | 1.4051 |
| 93 | 1.4758 |
| 94 | 1.5548 |
| 95 | 1.6449 |
| 96 | 1.7507 |
| 97 | 1.8808 |
| 98 | 2.0537 |
| 99 | 2.3263 |
Percentile to Z-Score: Calculator
Can you determine a Z-score if you know the percentile? Absolutely. With our Percentile to Z-Score Calculator, translating percentile ranks into Z-scores becomes straightforward.
Z-score to Percentile: Calculator
Can you calculate the percentile based on a known Z-score? Absolutely. With our Z-Score to Percentile Calculator, translating Z-scores into percentiles is both fast and easy.