This calculator cuts through the complexity of calculating the area between two Z-scores without the need for extensive statistical background or sifting through Z-tables.
Simply input below the two Z-scores between which you want to find the area (it accepts both positive and negative values) and then click “Calculate”.
It’s that easy.
Understanding the results
Let’s assume two specific Z-scores, -0.89 and 0.18. That means:
- Lower Z-score (Z1) = -0.89
- Upper Z-score (Z2) = 0.18
The area between these two values under the normal distribution curve represents the proportion of data within this range.
The result of the calculator is 0.38469.
This means that 38.07% of the data falls between these two Z-scores in a standard normal distribution.
Using a Z-table to calculate the area
If you’d like to identify the area between two Z-scores and don’t want to use a calculator, refer to a Z-table by finding the probabilities of each Z-score.
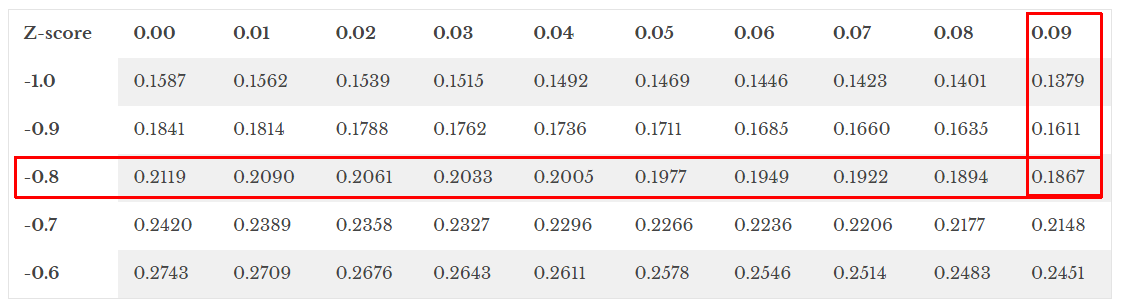
For -0.89 our Z-table says the probablity is:
For 0.18 our Z-table says the probability is:
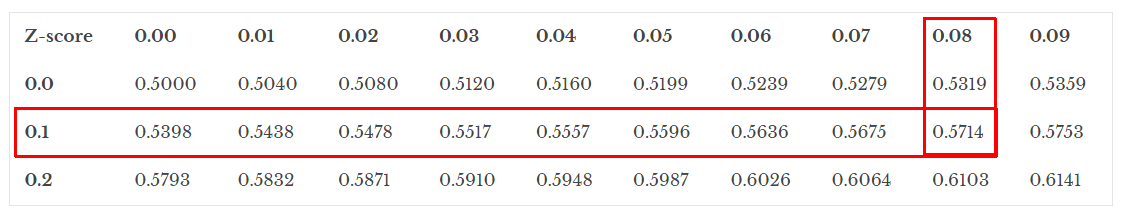
The area between -0.89 and 0.17 is then 0.5714 – 0.1867 = 0.3847.